Connected to design and process FMEAs, updated with every work order. Engineer-reviewed, source-traced, first draft in hours.
Referenced results your engineers can defend.
Failure modes hiding in plain sight. PM schedules based on assumptions, not evidence.
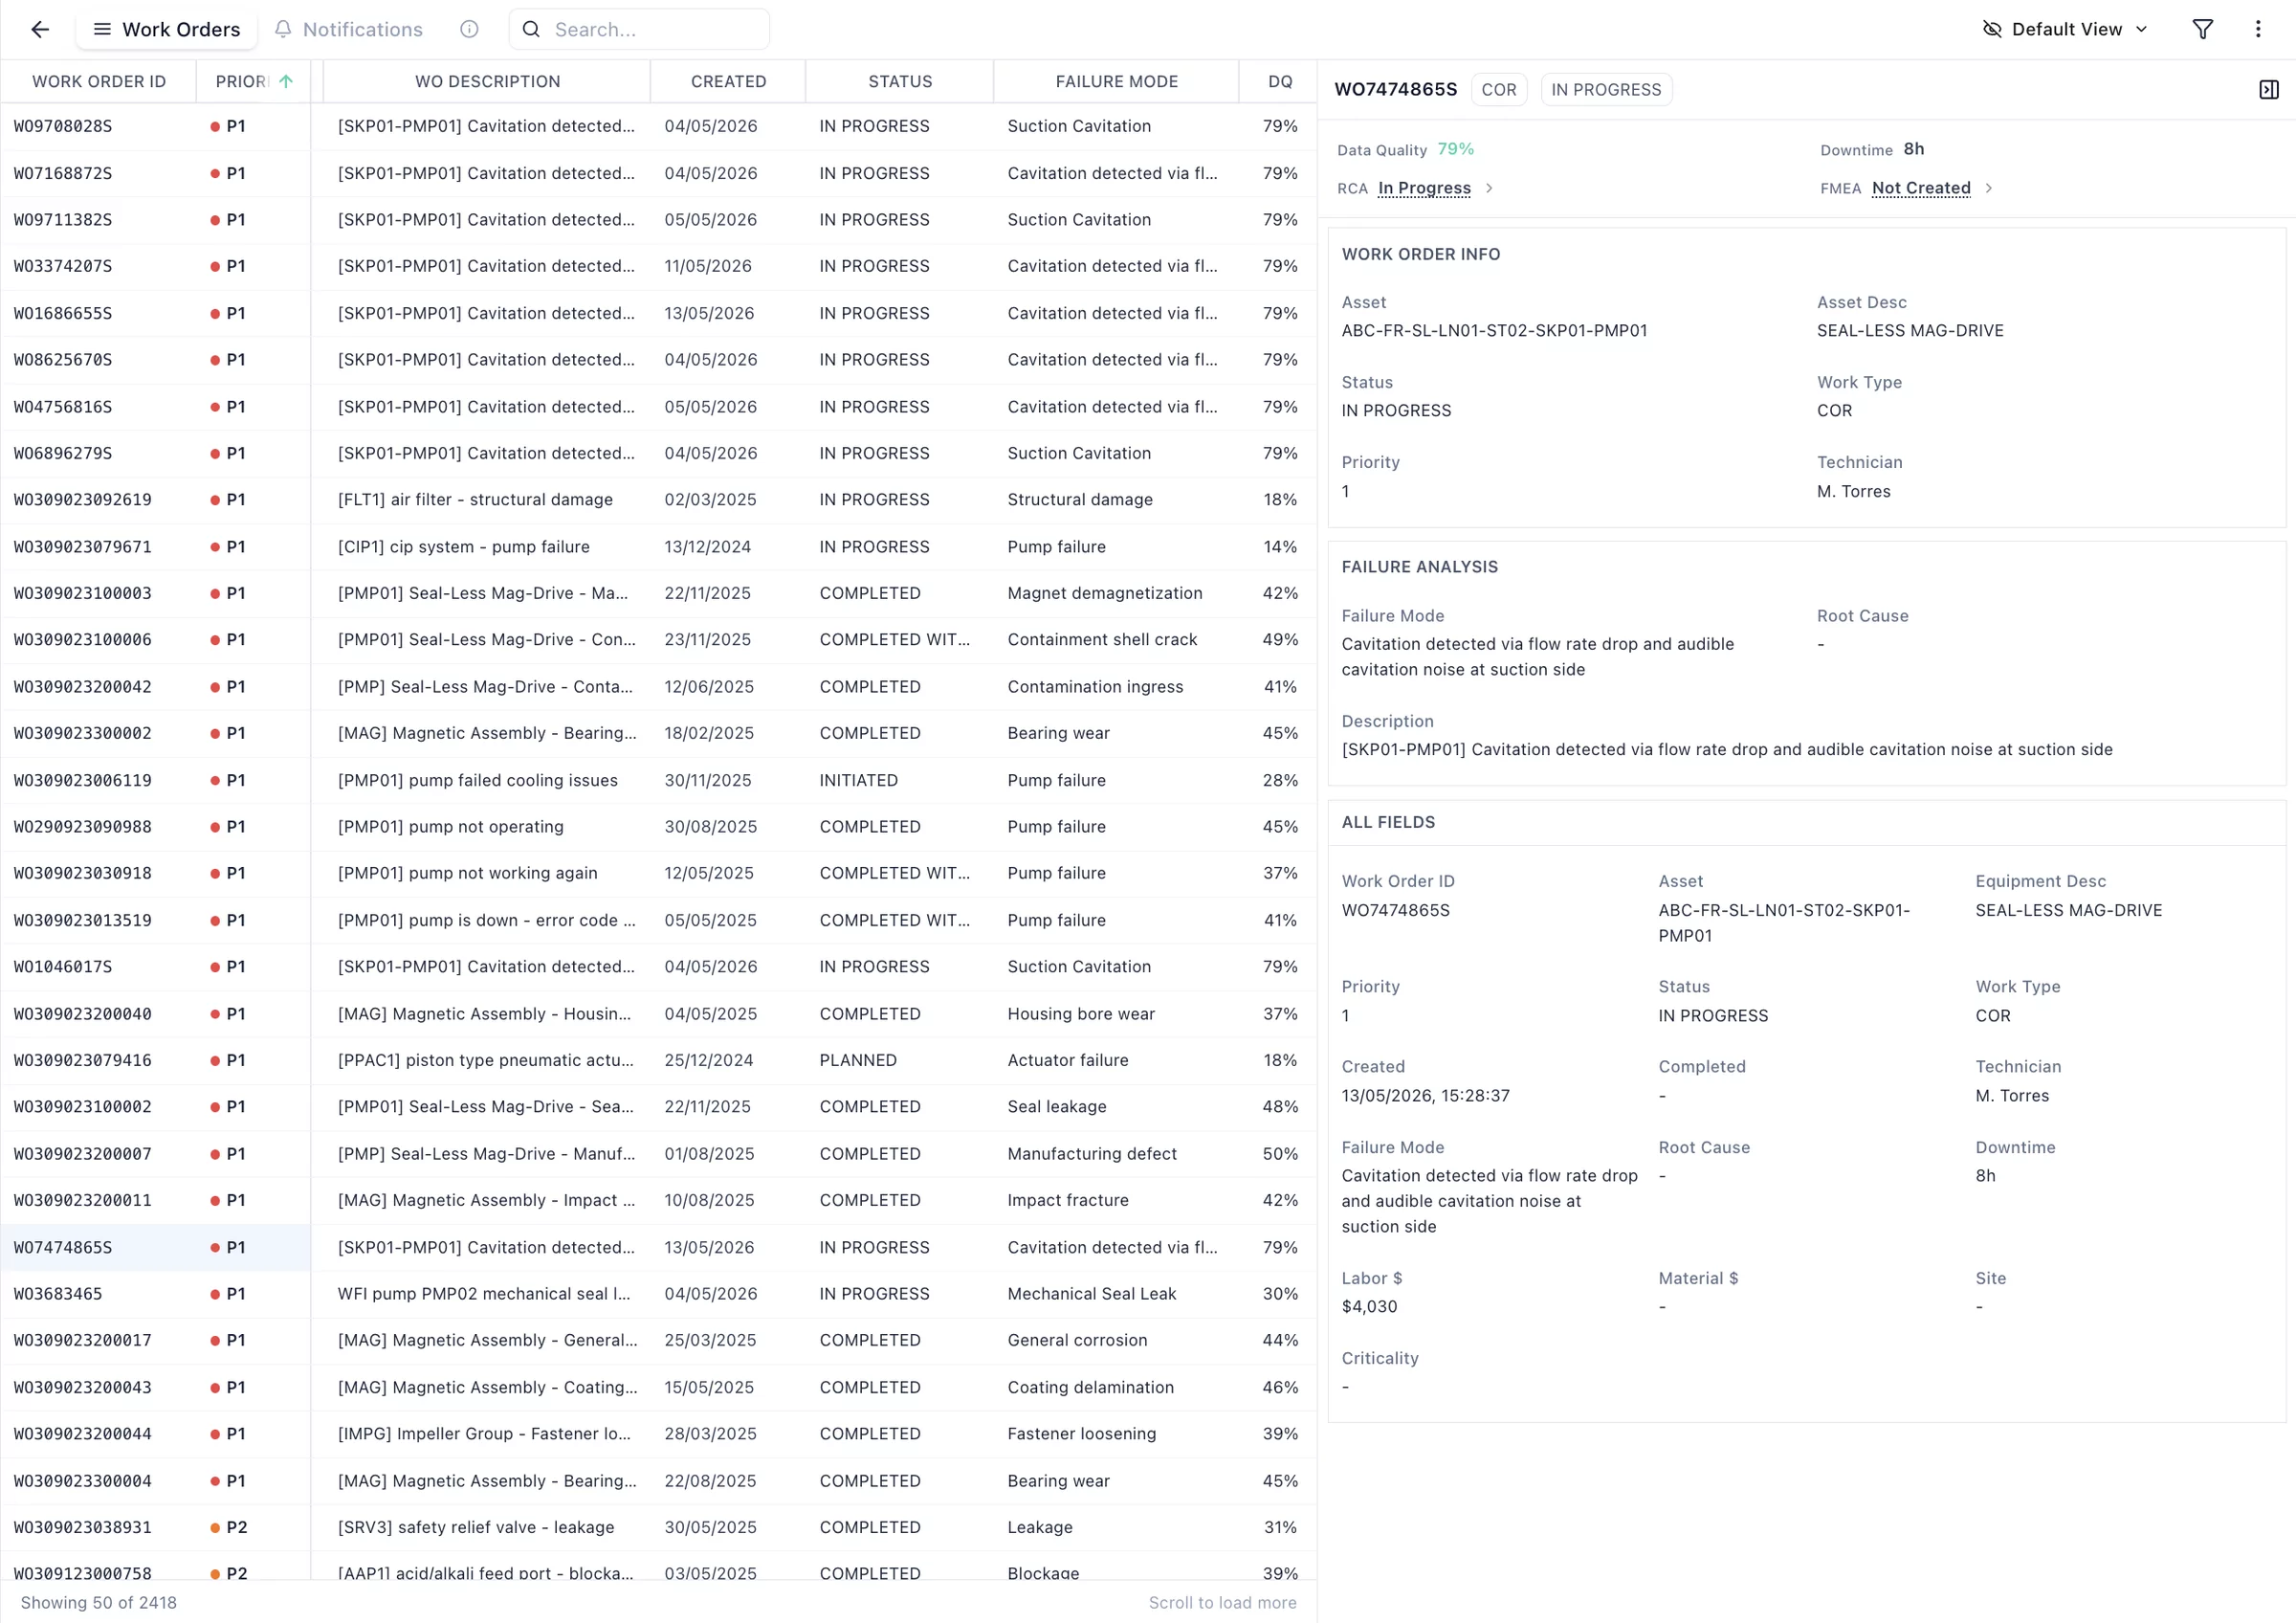
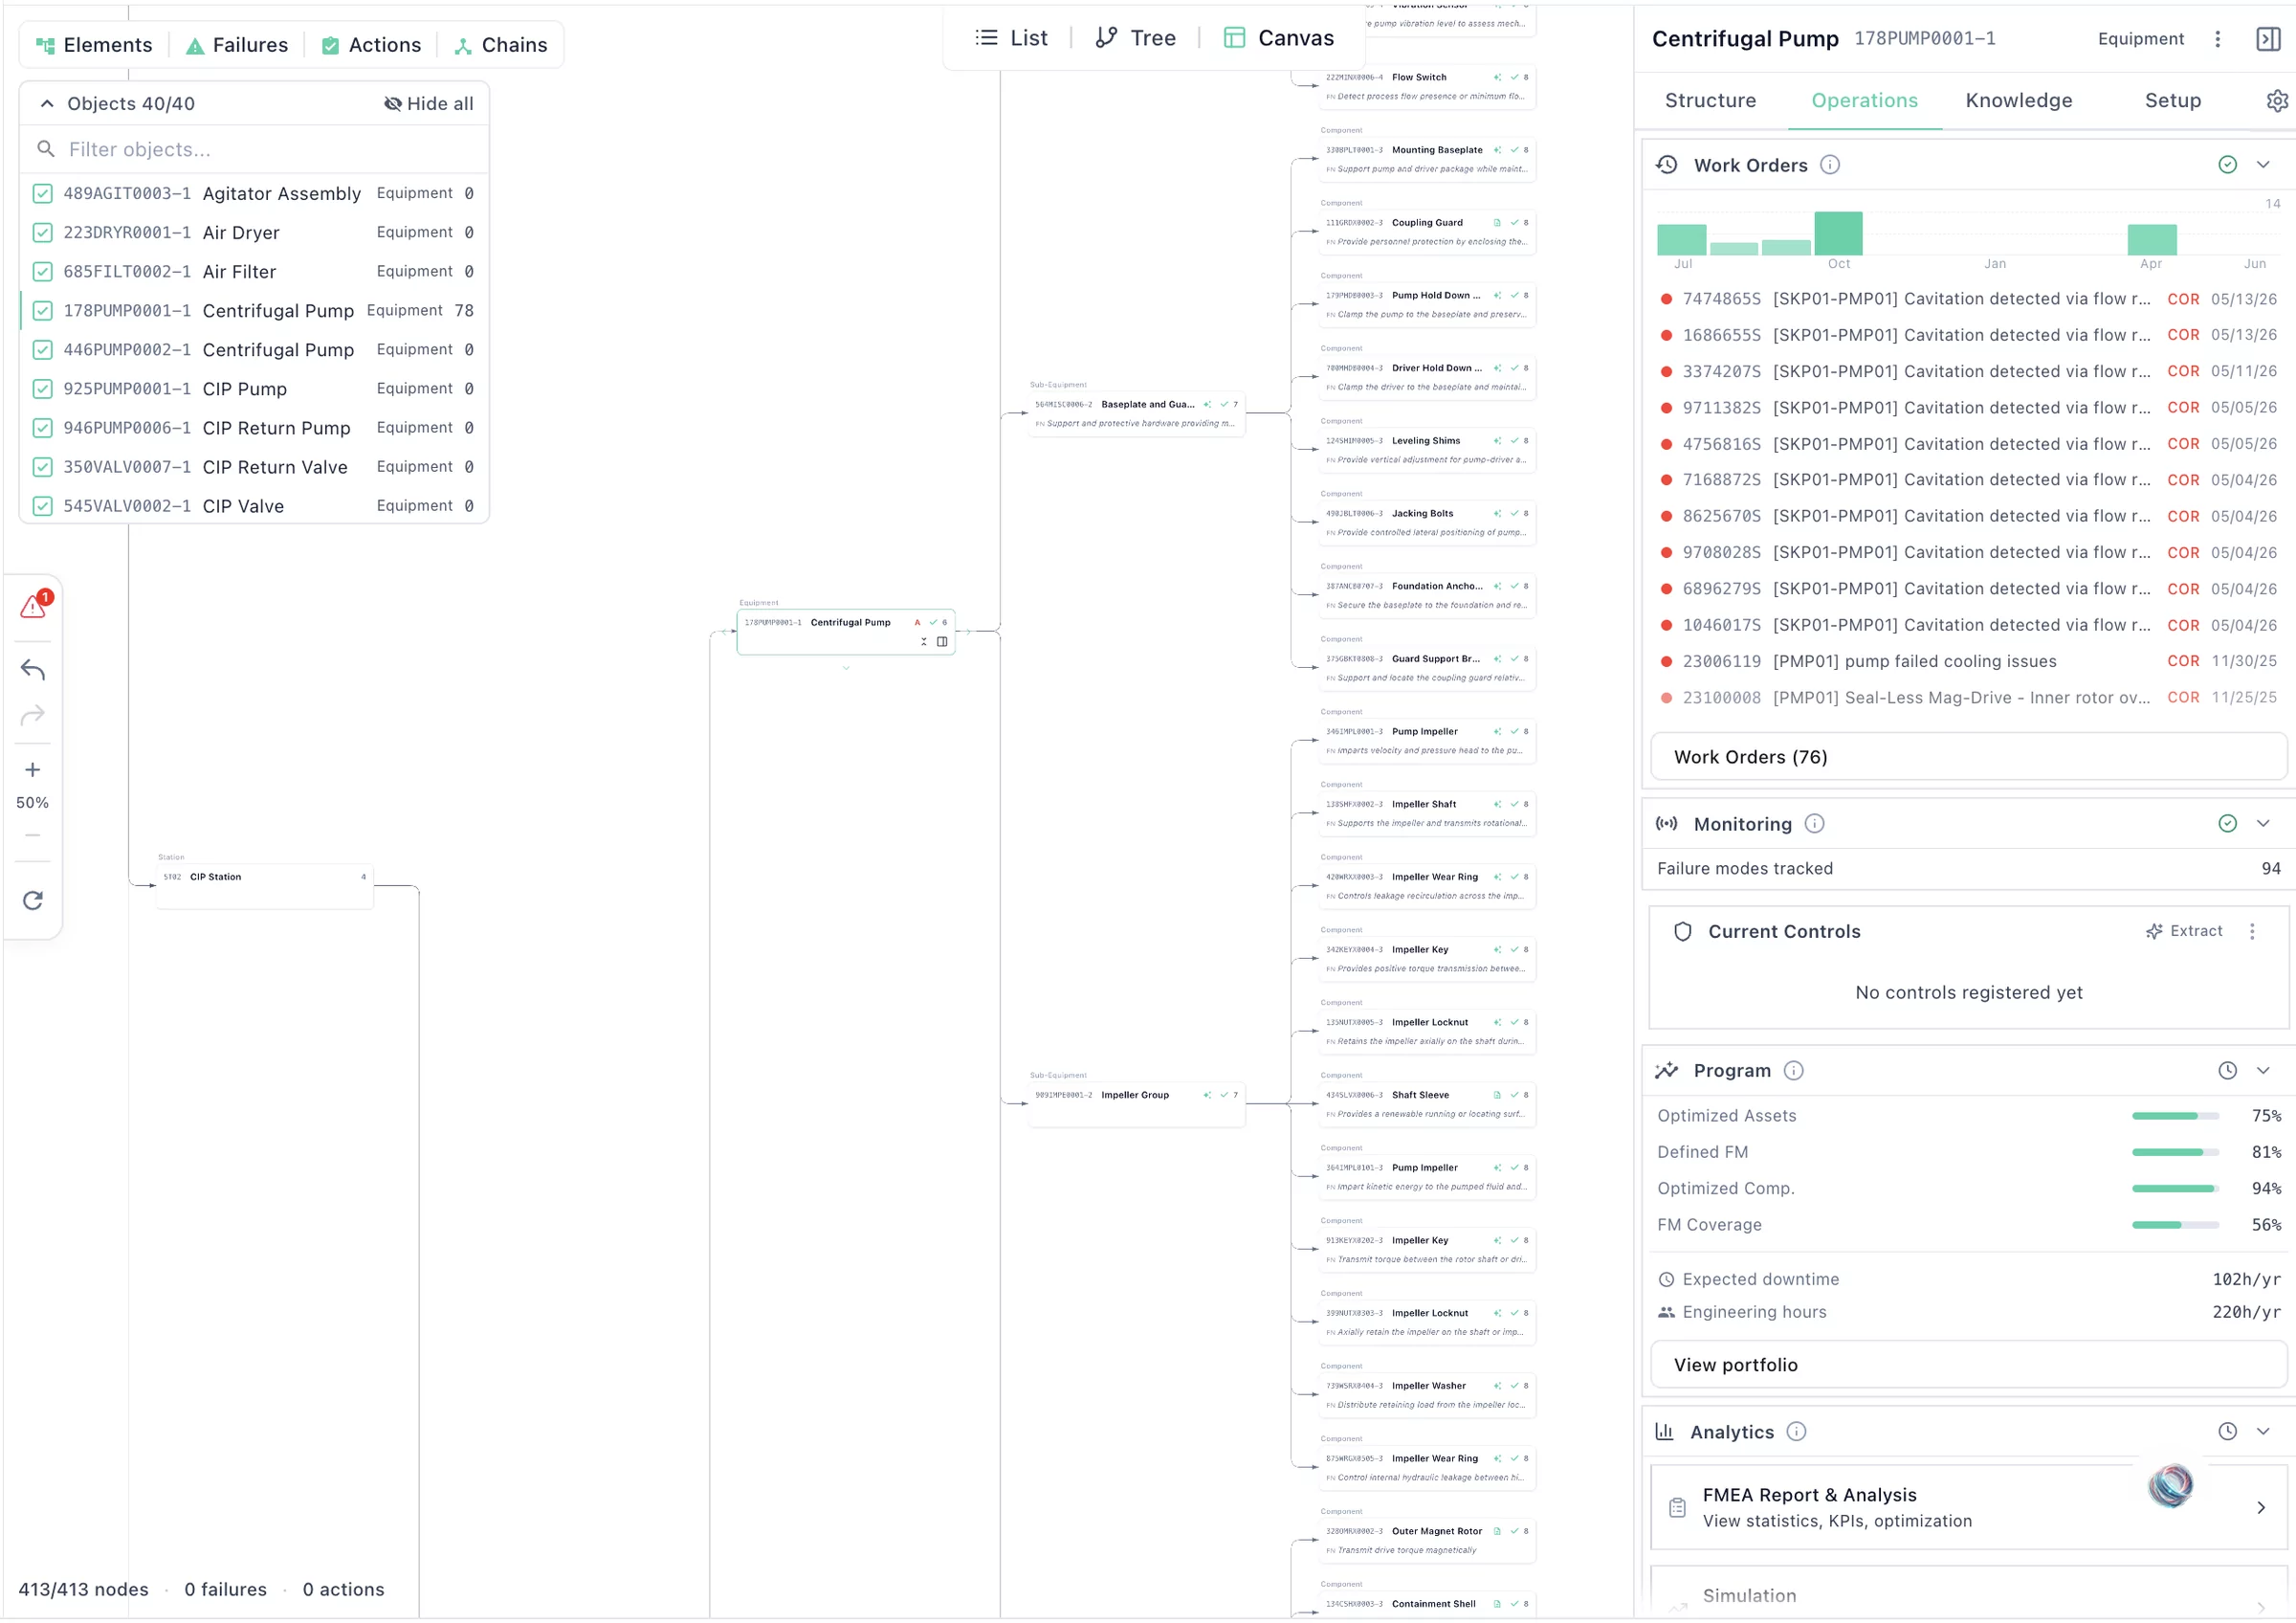
Export from SAP PM, Maximo, IFS, or any CMMS. The system extracts failure modes, causes, and data quality scores from unstructured text. It processes PDFs, manuals, P&IDs, and drawings alongside work orders. Equipment hierarchies are identified from drawings and functional location data. Bad actors ranked across your fleet by failure cost, frequency, and downtime.
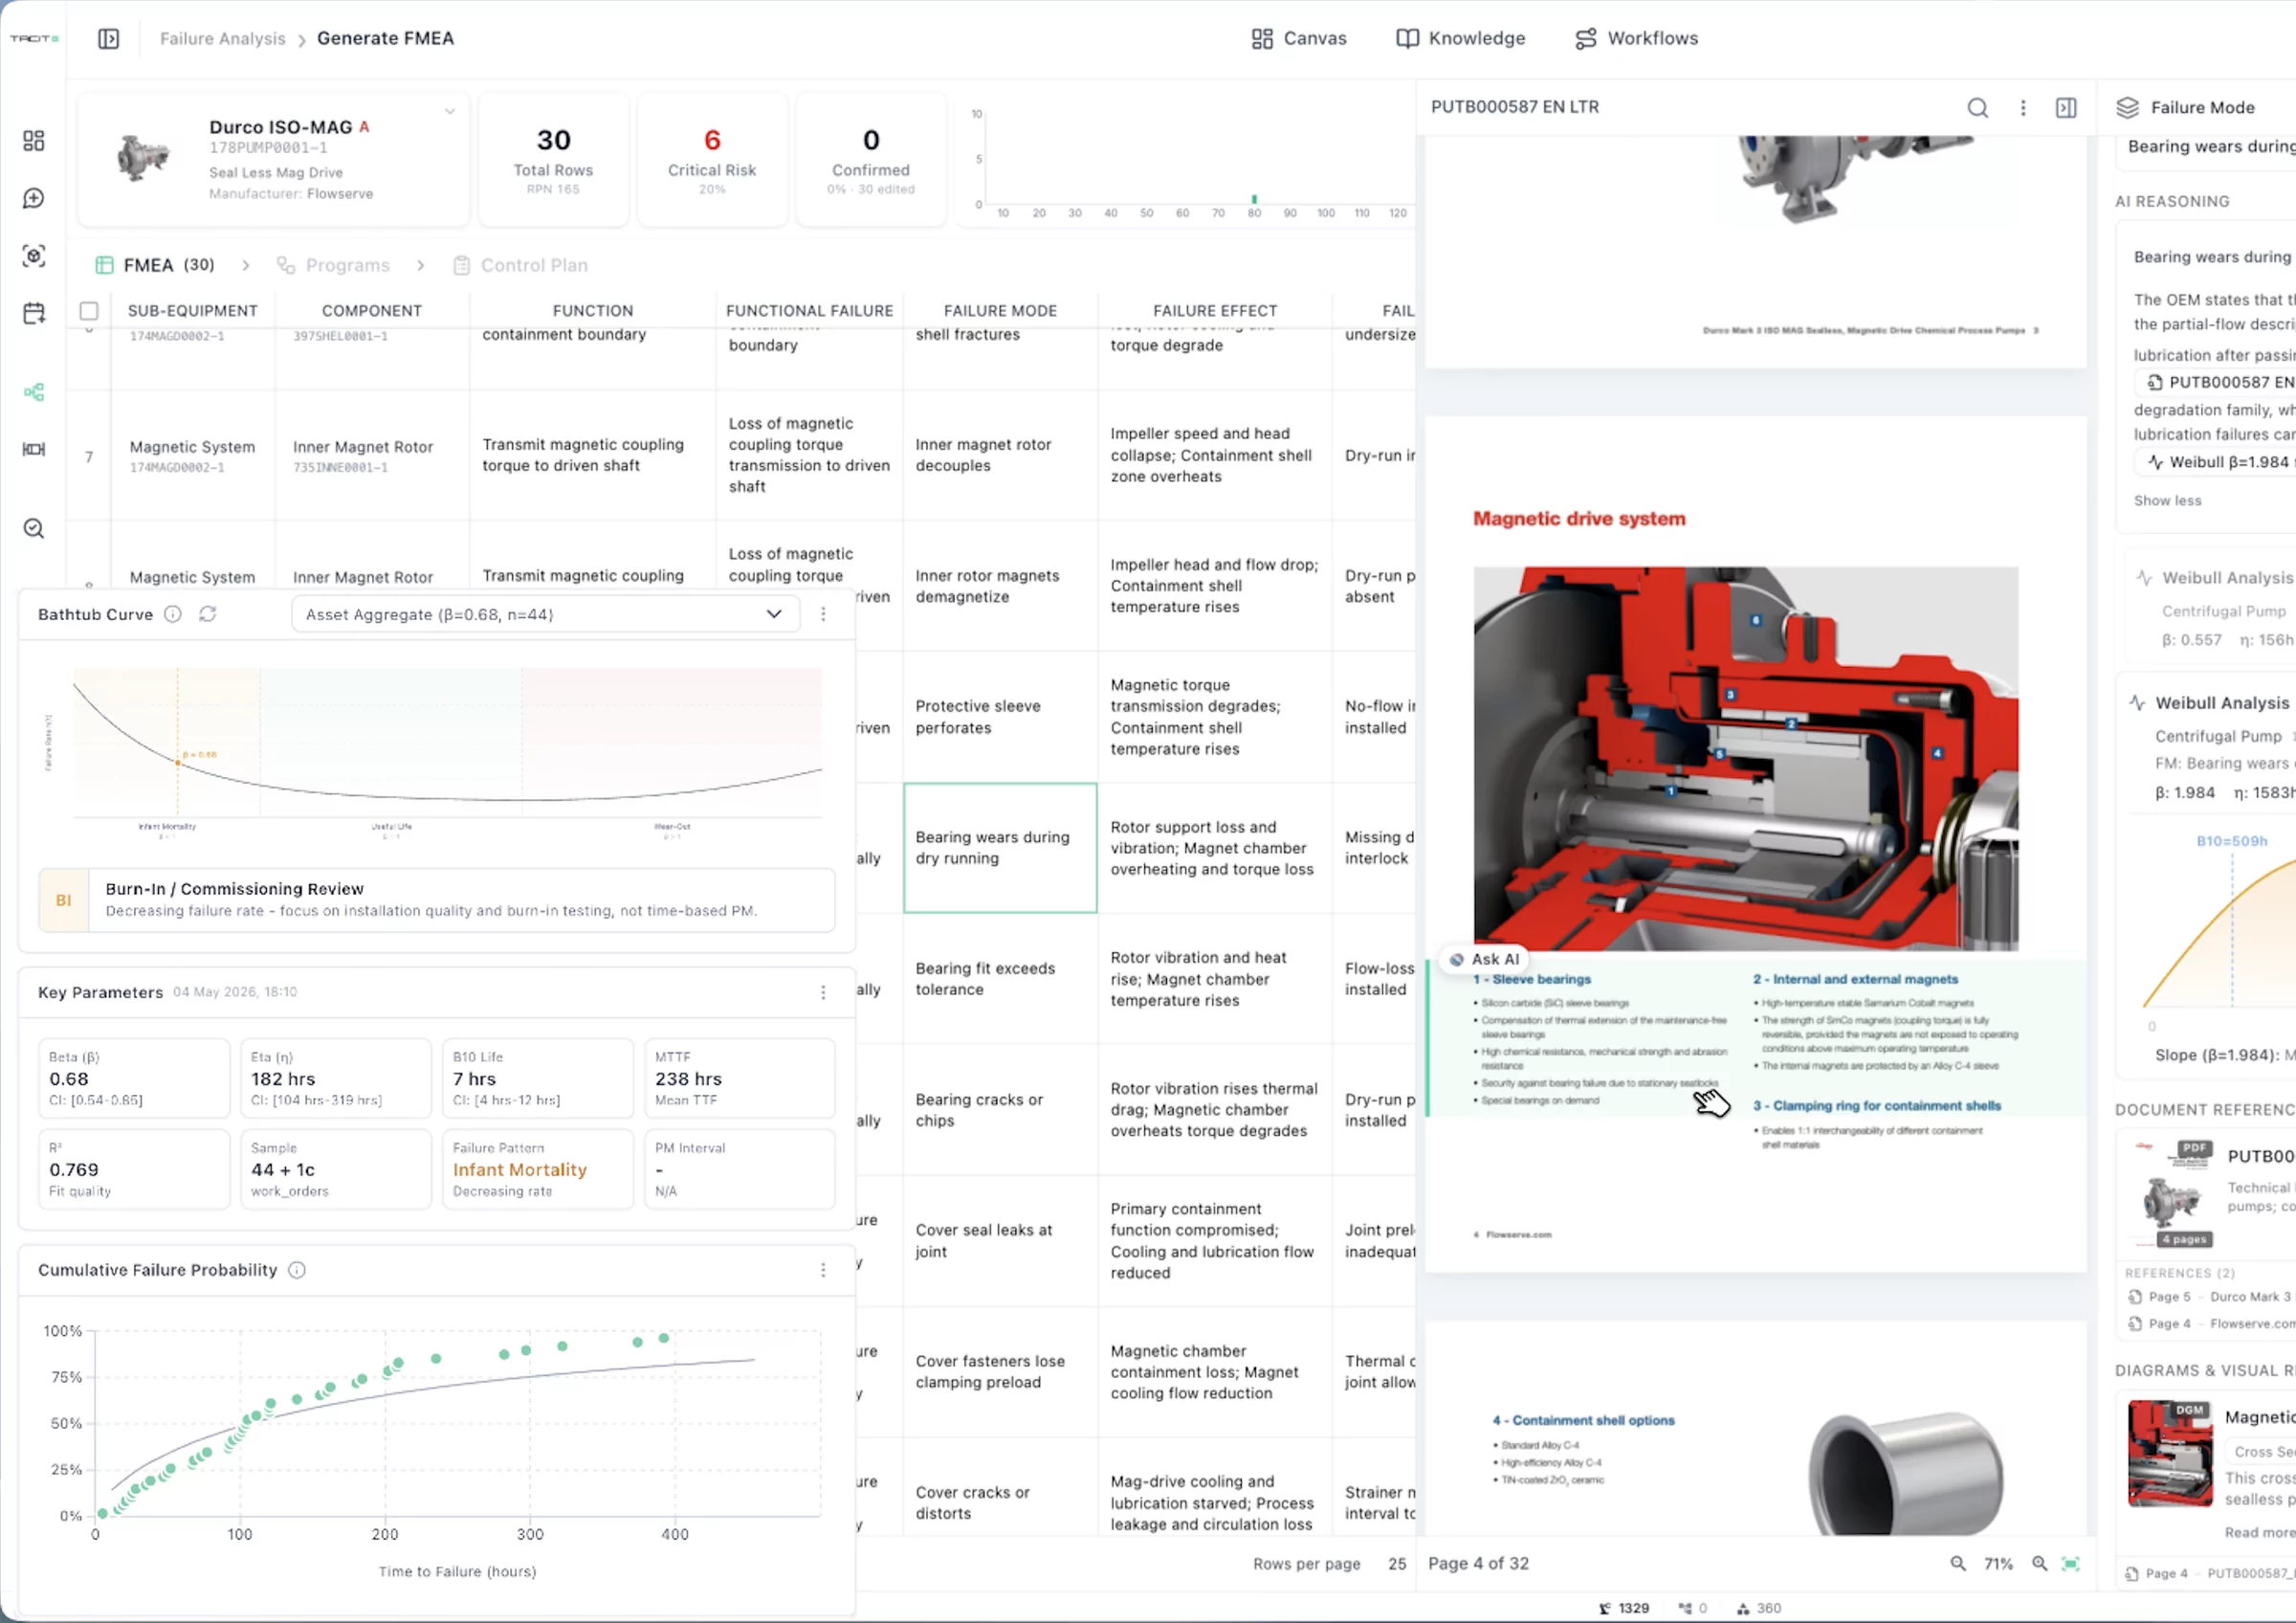
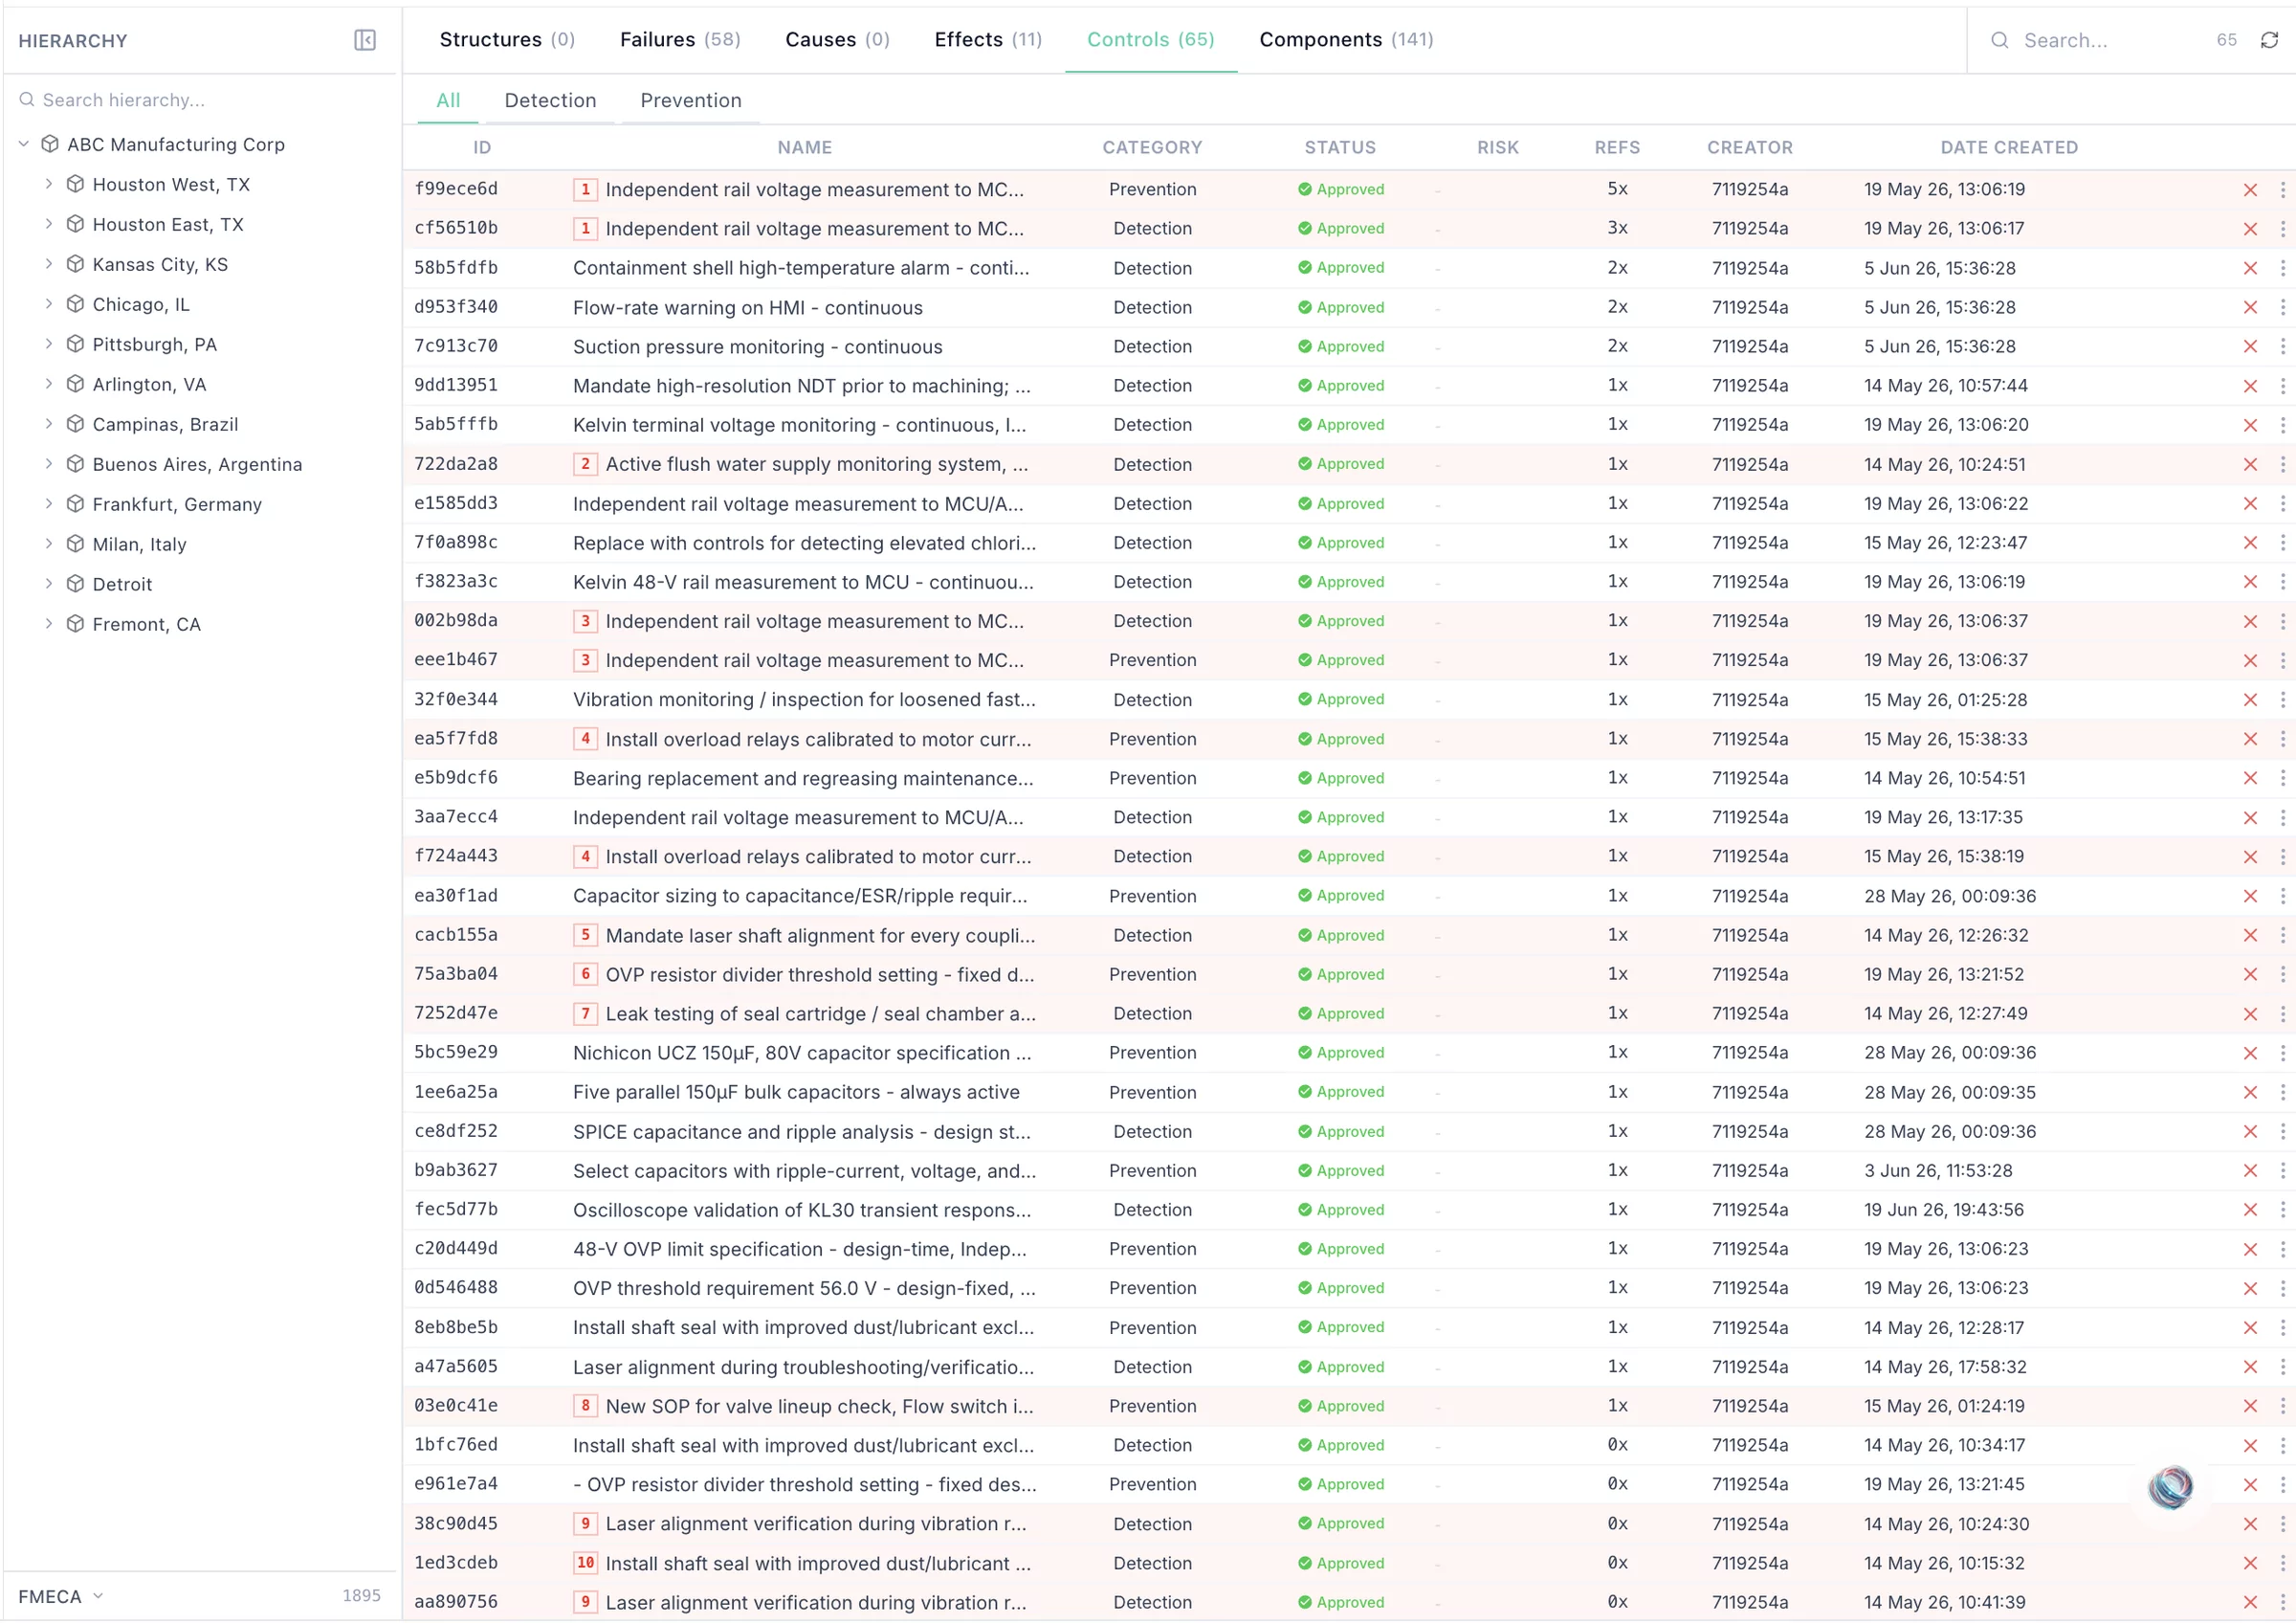
The system maps functions to each component, then derives failure modes from function loss with cause-effect chains across system boundaries. Complete FMECA rows include controls and mitigation tasks. RCM decision paths follow SAE JA1011. Work instructions are generated per row. When equipment data changes, affected rows are flagged for review. RCM-SAP export ready.
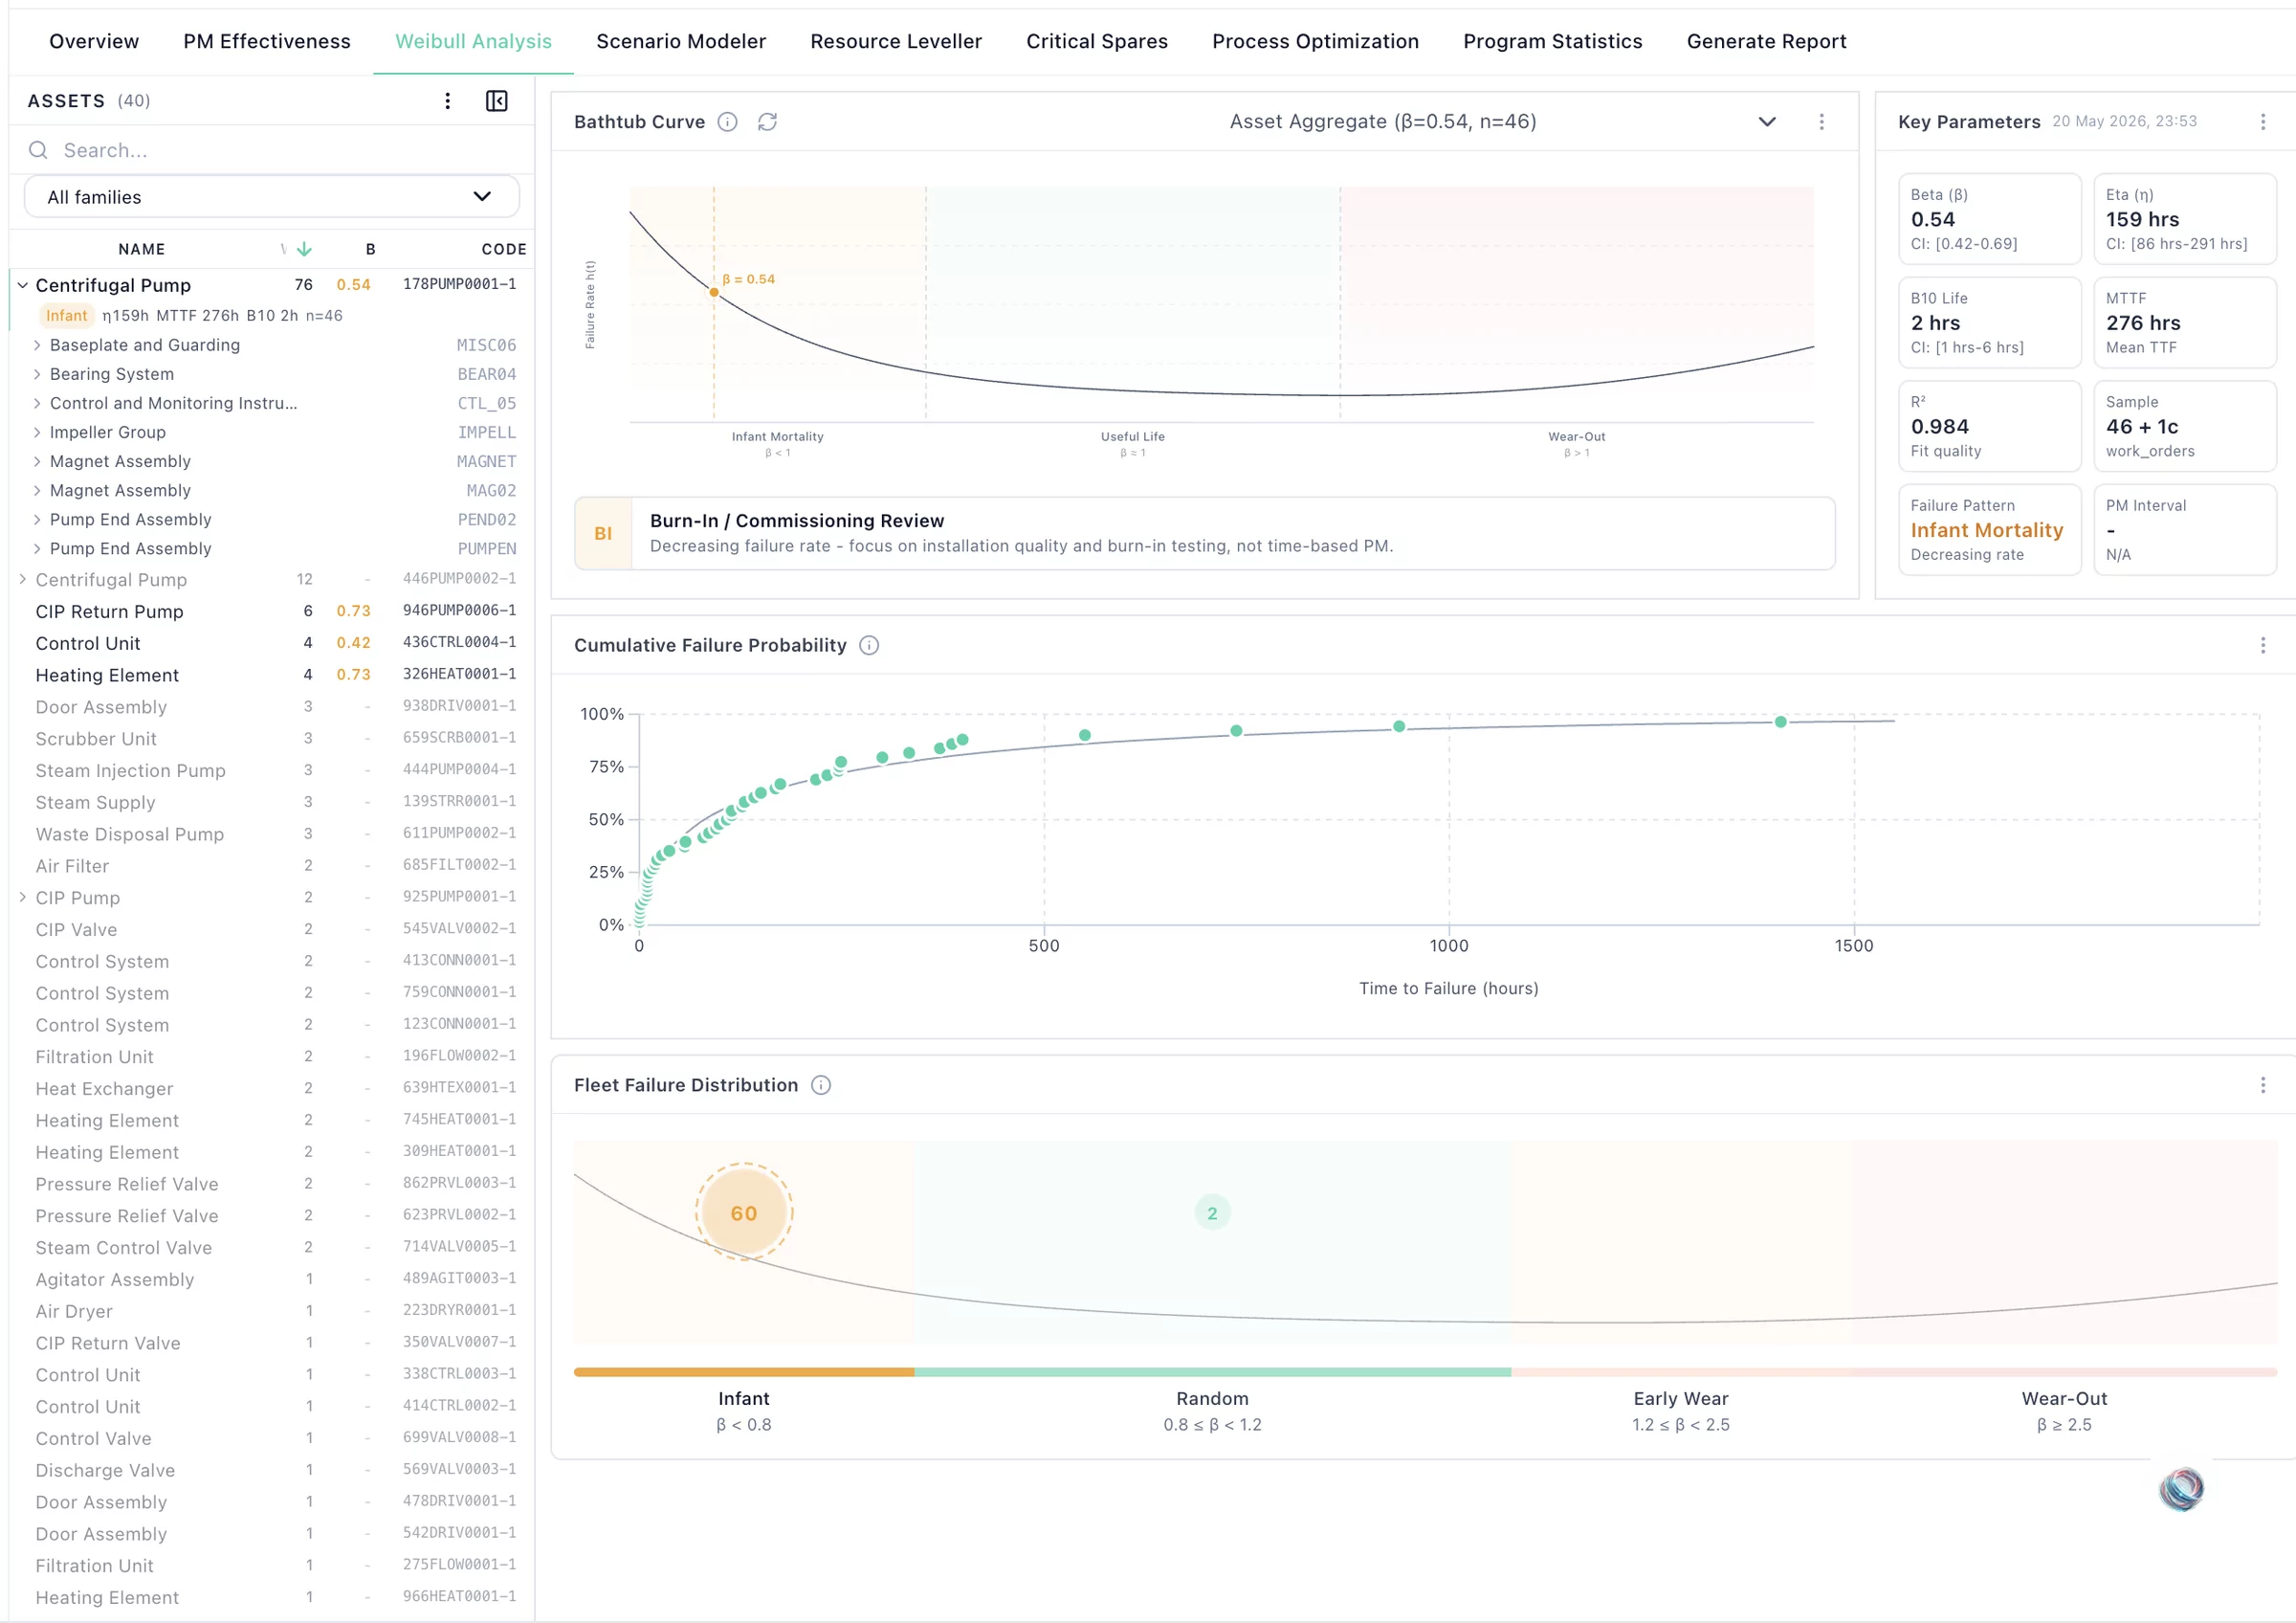
PM optimization driven by failure data, not assumptions. Weibull analysis and PF curves per failure mode. Scenario modeling to compare strategies. Spares recommendations based on failure frequency and lead time.
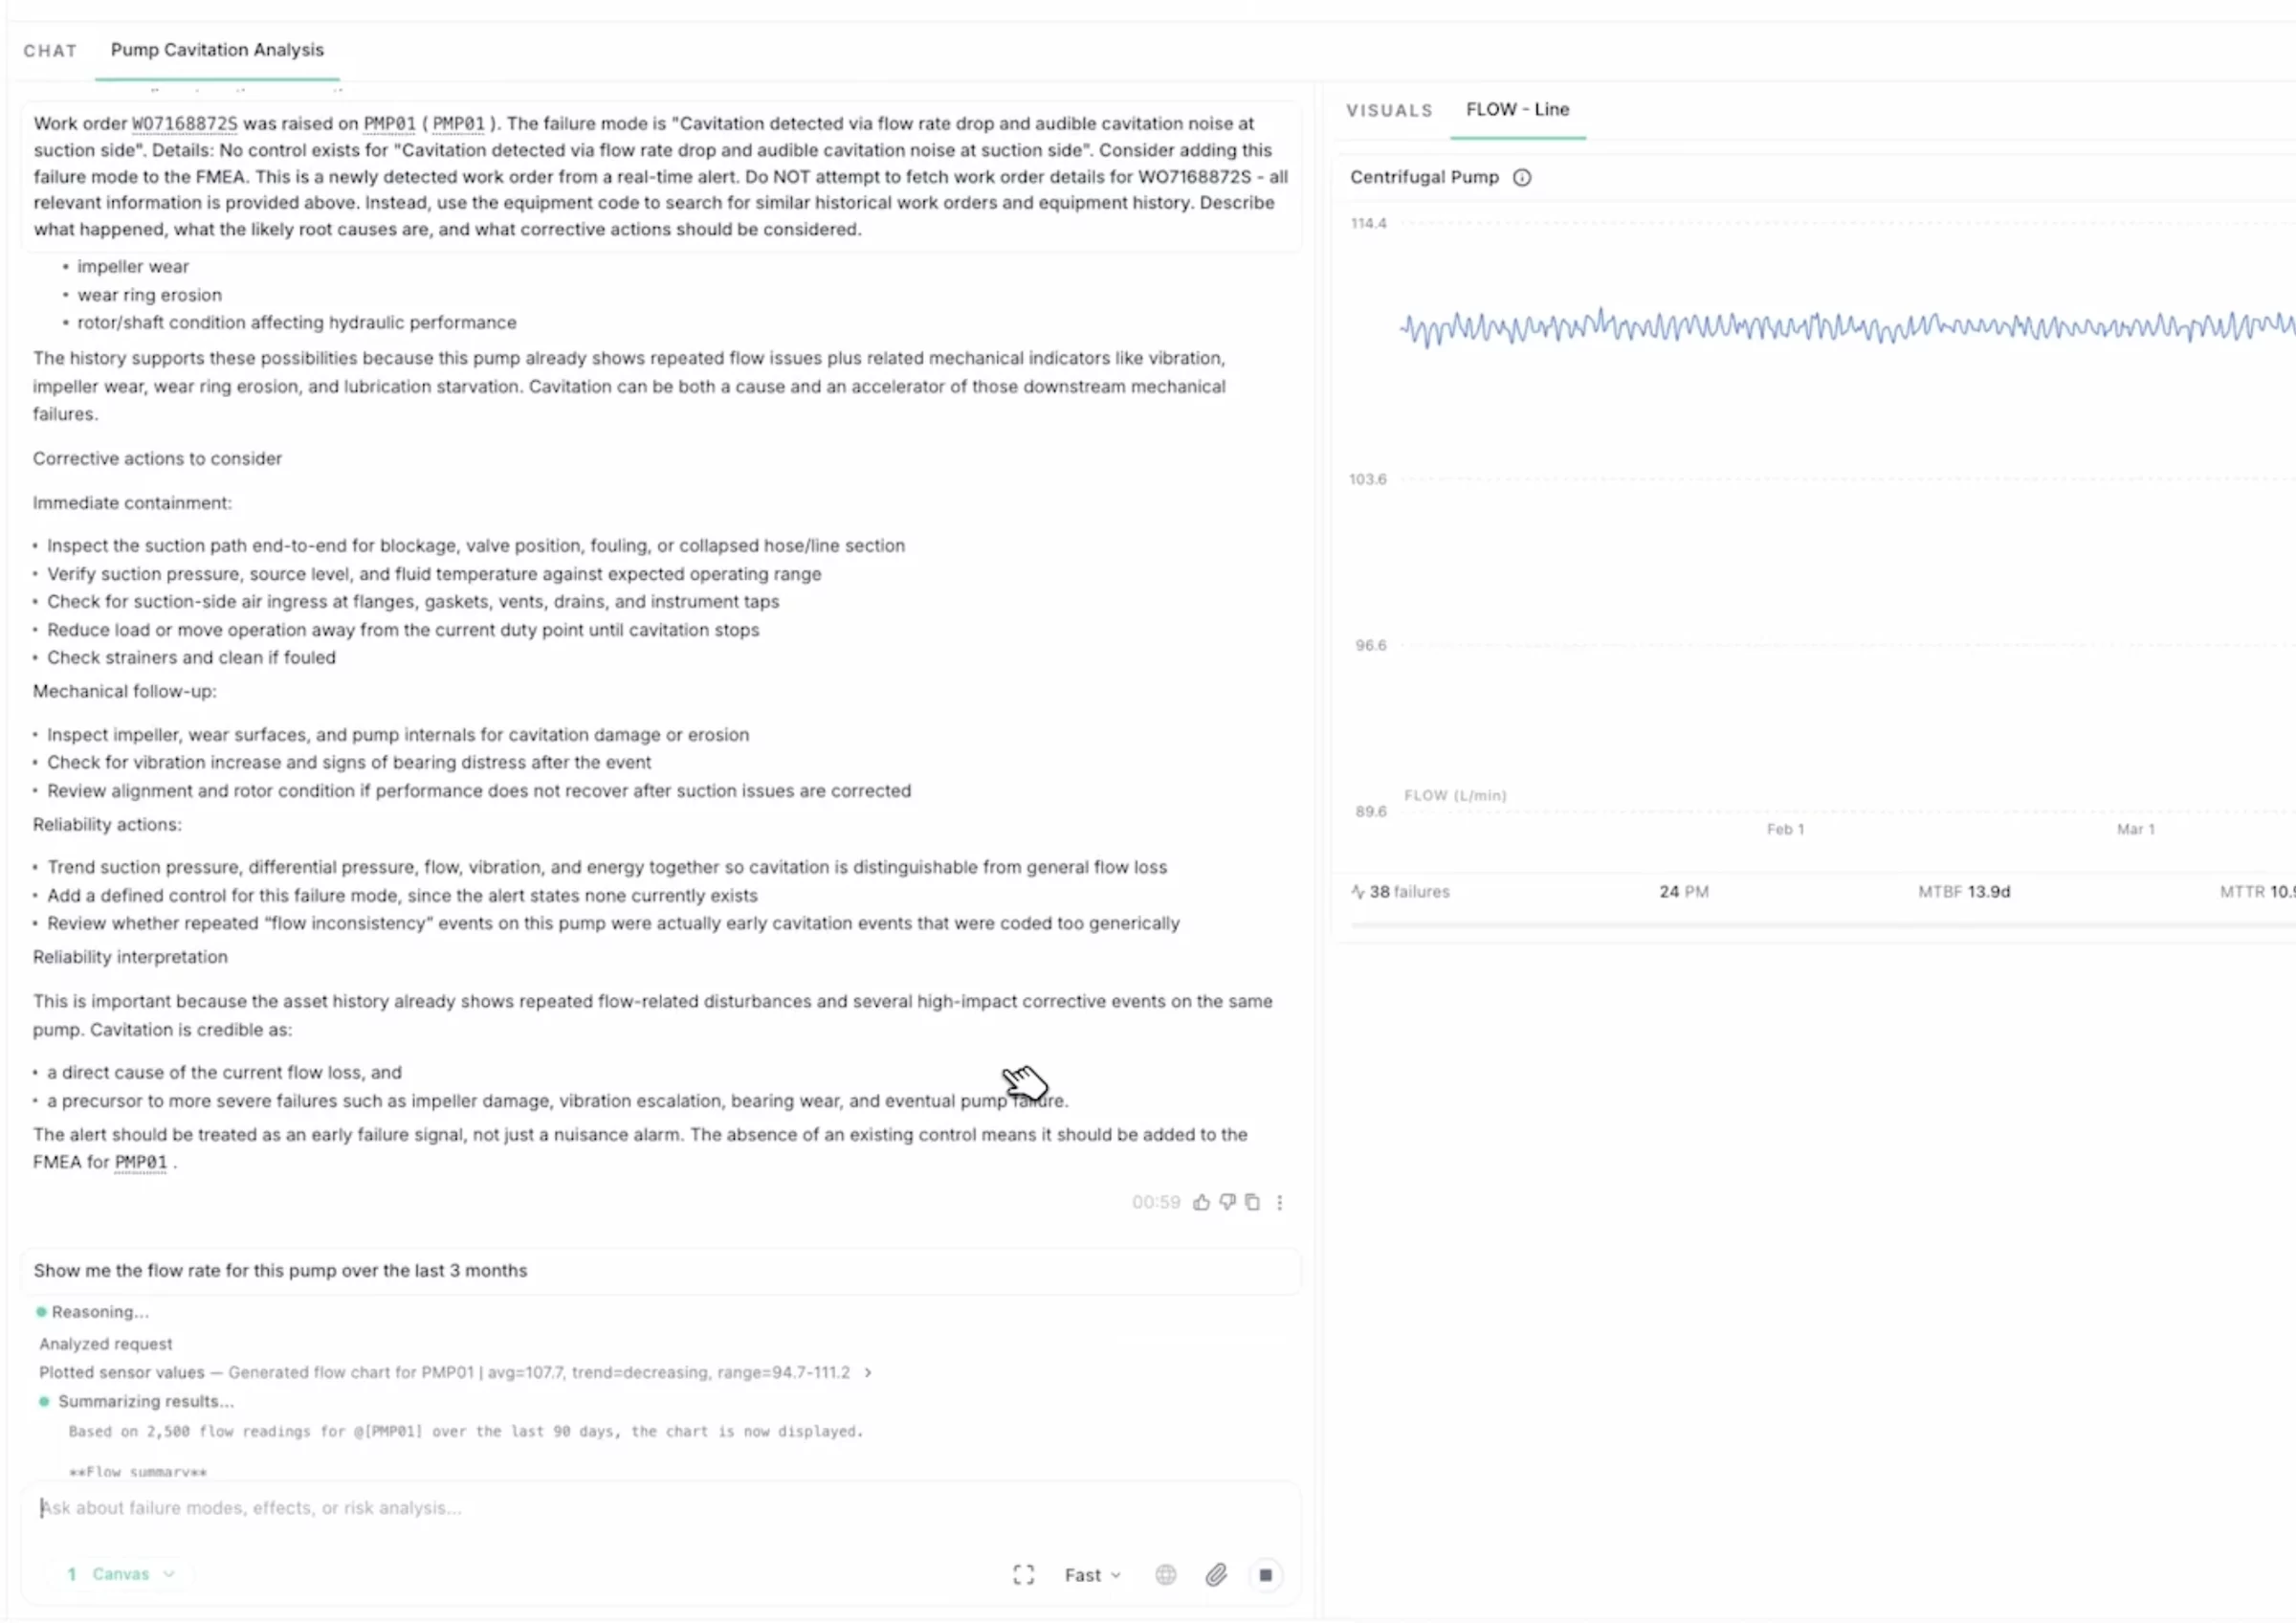
Natural language across work orders, manuals, and FMEAs. Cited answers with source documents. Run Weibull, generate PF curves, or bulk-edit FMEA cells directly. 34 languages.
The platform groups equipment by class, not serial number. Analyze one centrifugal pump type, the FMECA covers every instance. Corrections on one propagate to all. Functional locations, taxonomies, and failure coding standardized across sites. The hierarchy itself is a deliverable your team keeps.
The system stores every engineer review, correction, and confirmation. Confirm a failure mode on Agitator 1, it carries forward to Agitator 47 without re-entry. No drift between analysts or sessions. Results are reproducible and auditable across your entire fleet.
70-90% complete. IEC 60812 and SAE J1739 compliant. Failure modes, causes, mechanisms, and SOD scores. All rows traceable to source.
Top failure modes ranked by RPN, frequency, and downtime impact. Your team knows exactly where to focus effort and budget.
Weibull-driven PM intervals. PF curve analysis. Scenario modeling to compare strategies. Task prioritization by risk and criticality.
Every work order scored for completeness, consistency, and failure data richness. Identify systemic gaps in your CMMS data capture.
Spares recommendations based on failure frequency, lead time, and criticality. Reduce stockouts without inflating inventory cost.
Reliability block diagrams with Monte Carlo simulation. Model system availability, identify single points of failure, and optimize redundancy and spares decisions.
Each FMECA row linked to the work order, manual, or inspection report it came from. When data changes, affected rows are flagged. Audit-ready.
Equipment classes, functional locations, and failure taxonomies aligned across sites. Corrections on one class propagate to all instances. The hierarchy is a standalone deliverable.
New work orders and failure events matched to FMECA rows. Recurring failures flagged. PM tasks marked ineffective when failures persist. Gaps surfaced as new failure-mode suggestions.
Pass your engineers' review → scale site-wide.
From no structured risk strategy to a fully auditable, cross-functional FMEA that feeds design changes, work orders, and inspections.


Bring one manual. We show you what yours missed. 30 minutes.