Process & Manufacturing

PFMEAs that know about
yesterday’s scrap.

Linked to DFMEA and field data. Control plans update when defect patterns shift. AIAG-VDA native.

Referenced results your engineers can defend.


TacitAI Process Engineer — PFMEA workspace

TacitAI Process Engineer — PFMEA workspace


Results from current process & PFMEA deployments

Live
defect data updates PFMEA
Production deployments
70–90%
engineer-ready on first draft
Production deployments
100%
linked to control plan & Cpk
All deployments
Closed loop
defects flow back to PFMEA
All deployments
IATF / PPAP
audit-ready output
All deployments

The Gap

Your PFMEA doesn't know about yesterday's scrap.

Defects, rework, inspection failures. All logged. None of it flows back.

Less than 5% of defect data ever updates a control plan. Engineer headcount stays flat while PFMEA volume grows with every new line and OEM requirement. The gap widens every year.


01
"40 stations - how do I map them all?"

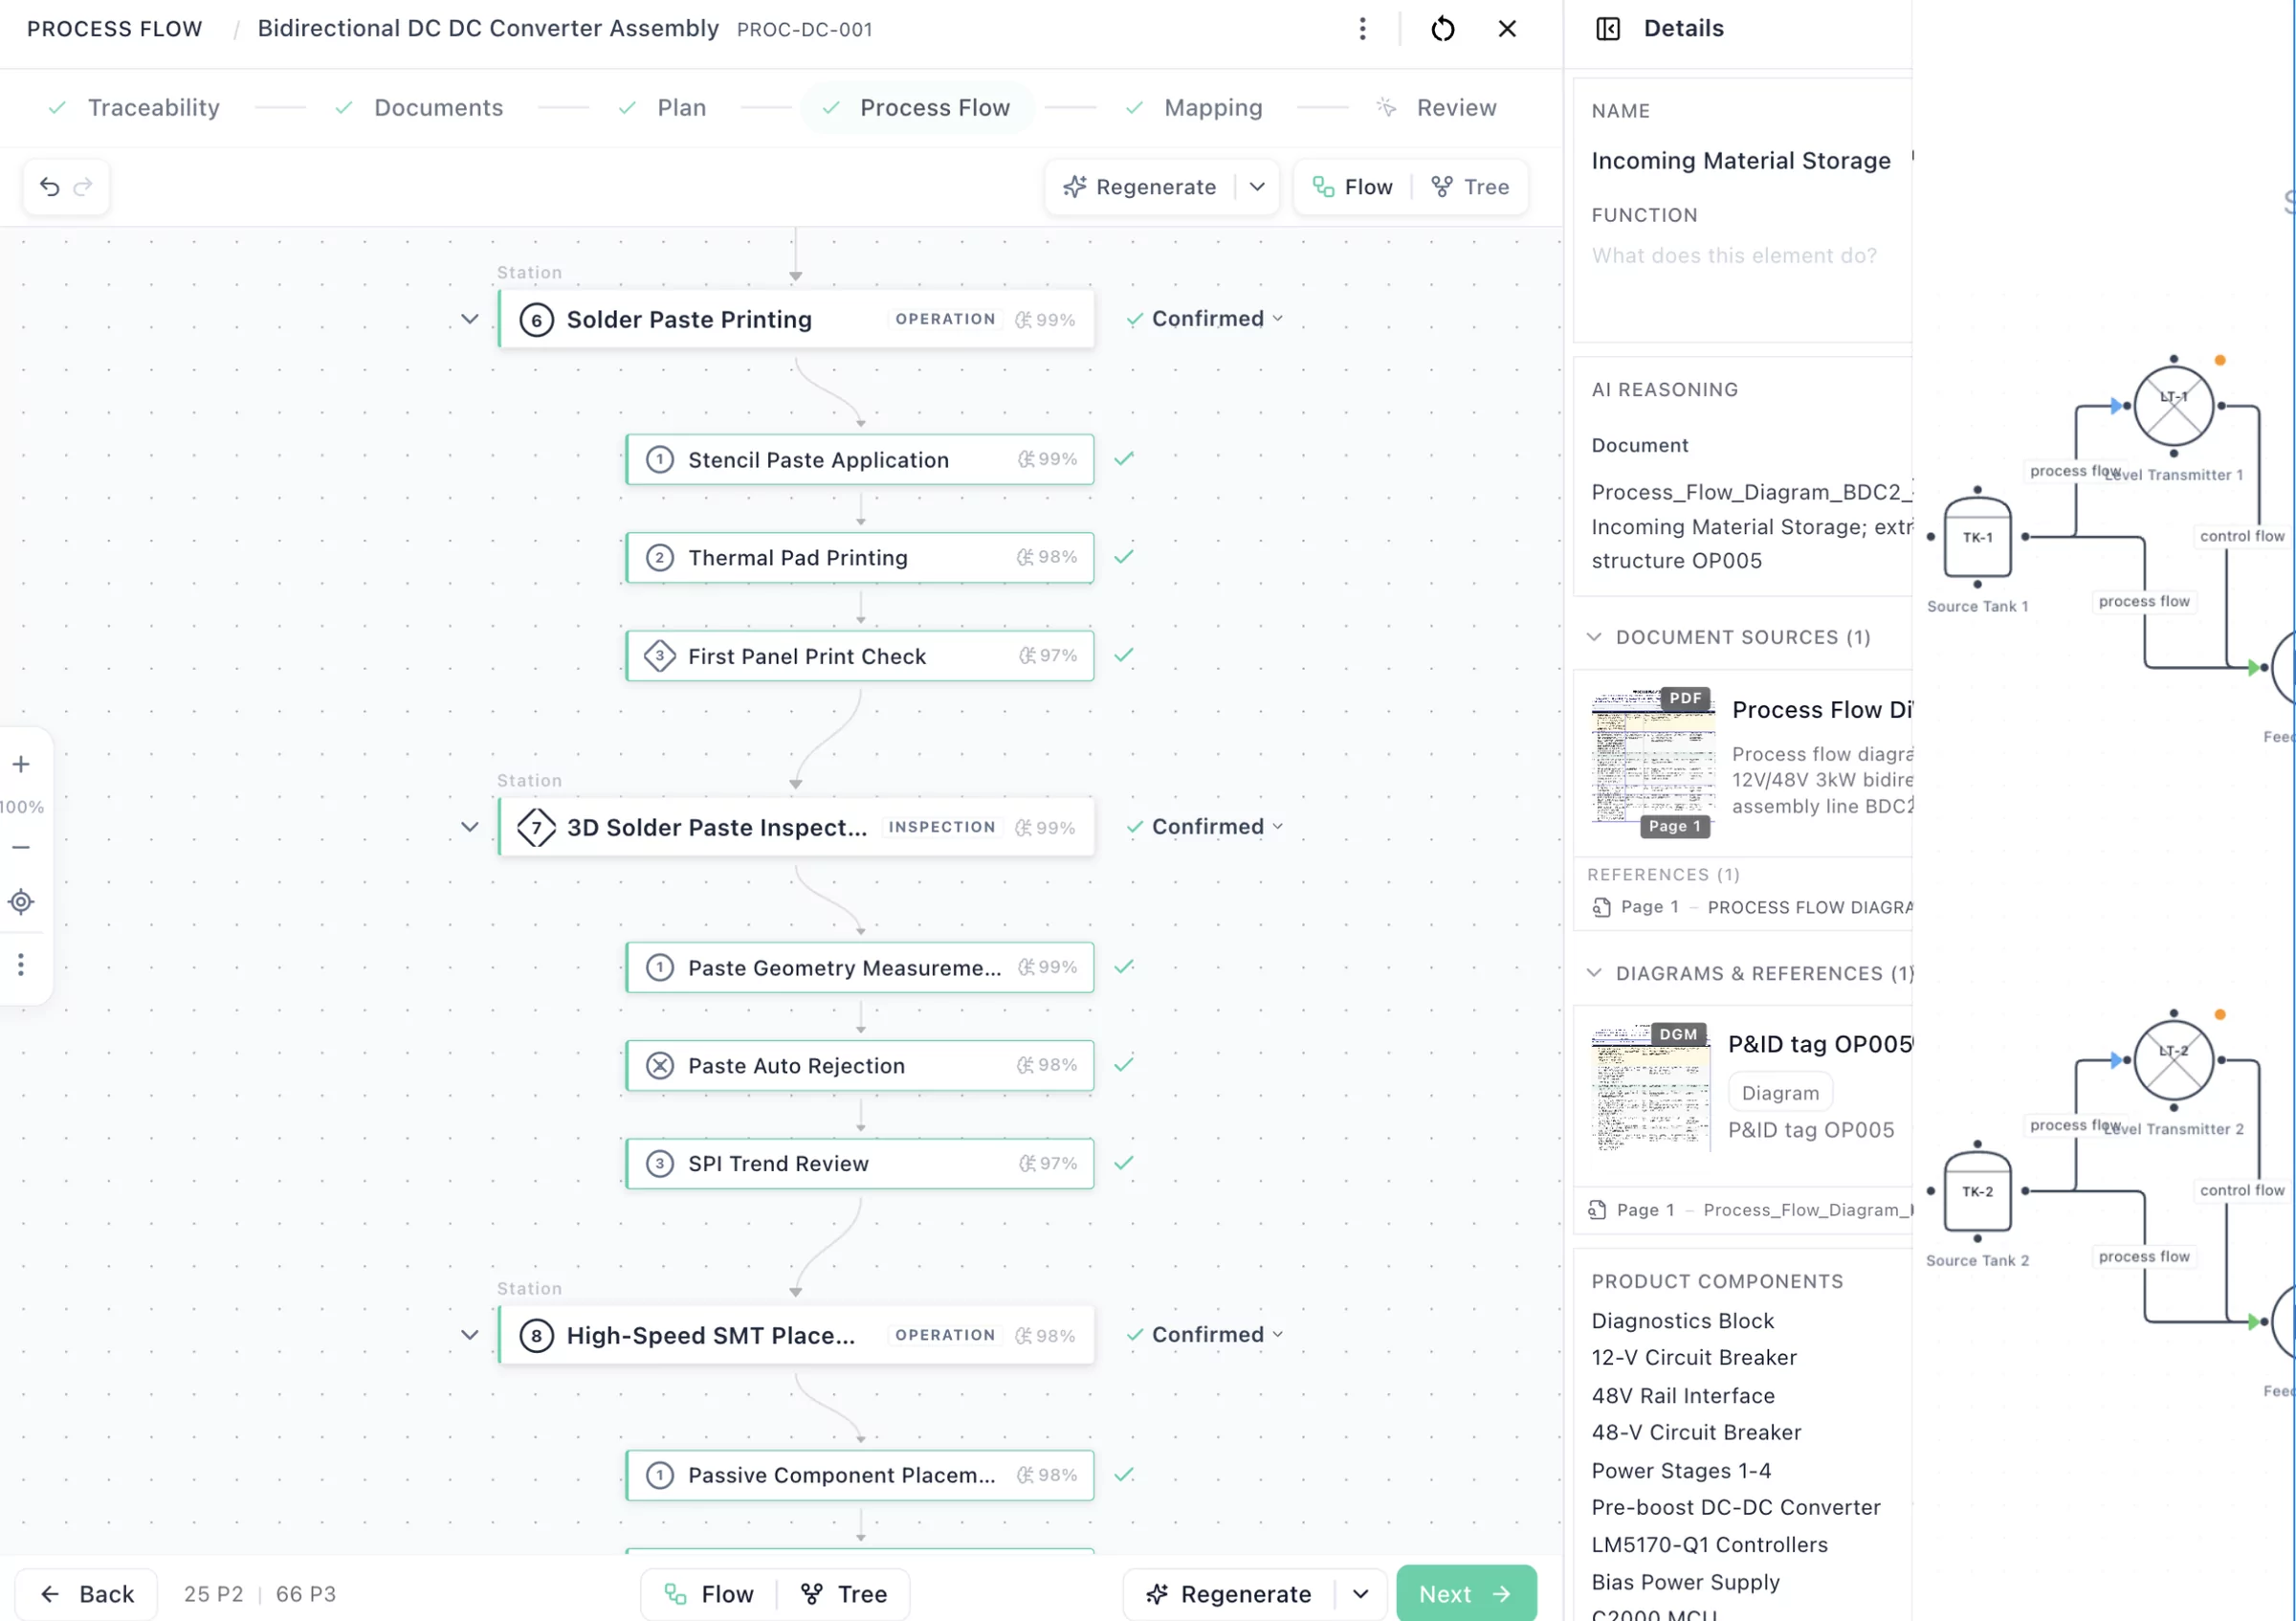
Process hierarchy from your flow. Every station mapped.

Import or generate process flows and P&IDs from MES, ERP, Excel, or PDF. Process topologies identified automatically. AIAG step types recognized. Visual flow summary with coverage indicators per station. Click any node to see failure modes, controls, and gaps.

Process Flow & P&ID
Topology Identification
Station Coverage Map
DFMEA Severity Linkage
Document Intelligence

Process flow with station mapping, operations, inspections, and document sources

02
"We have 40 stations and no structured PFMEA for half of them."

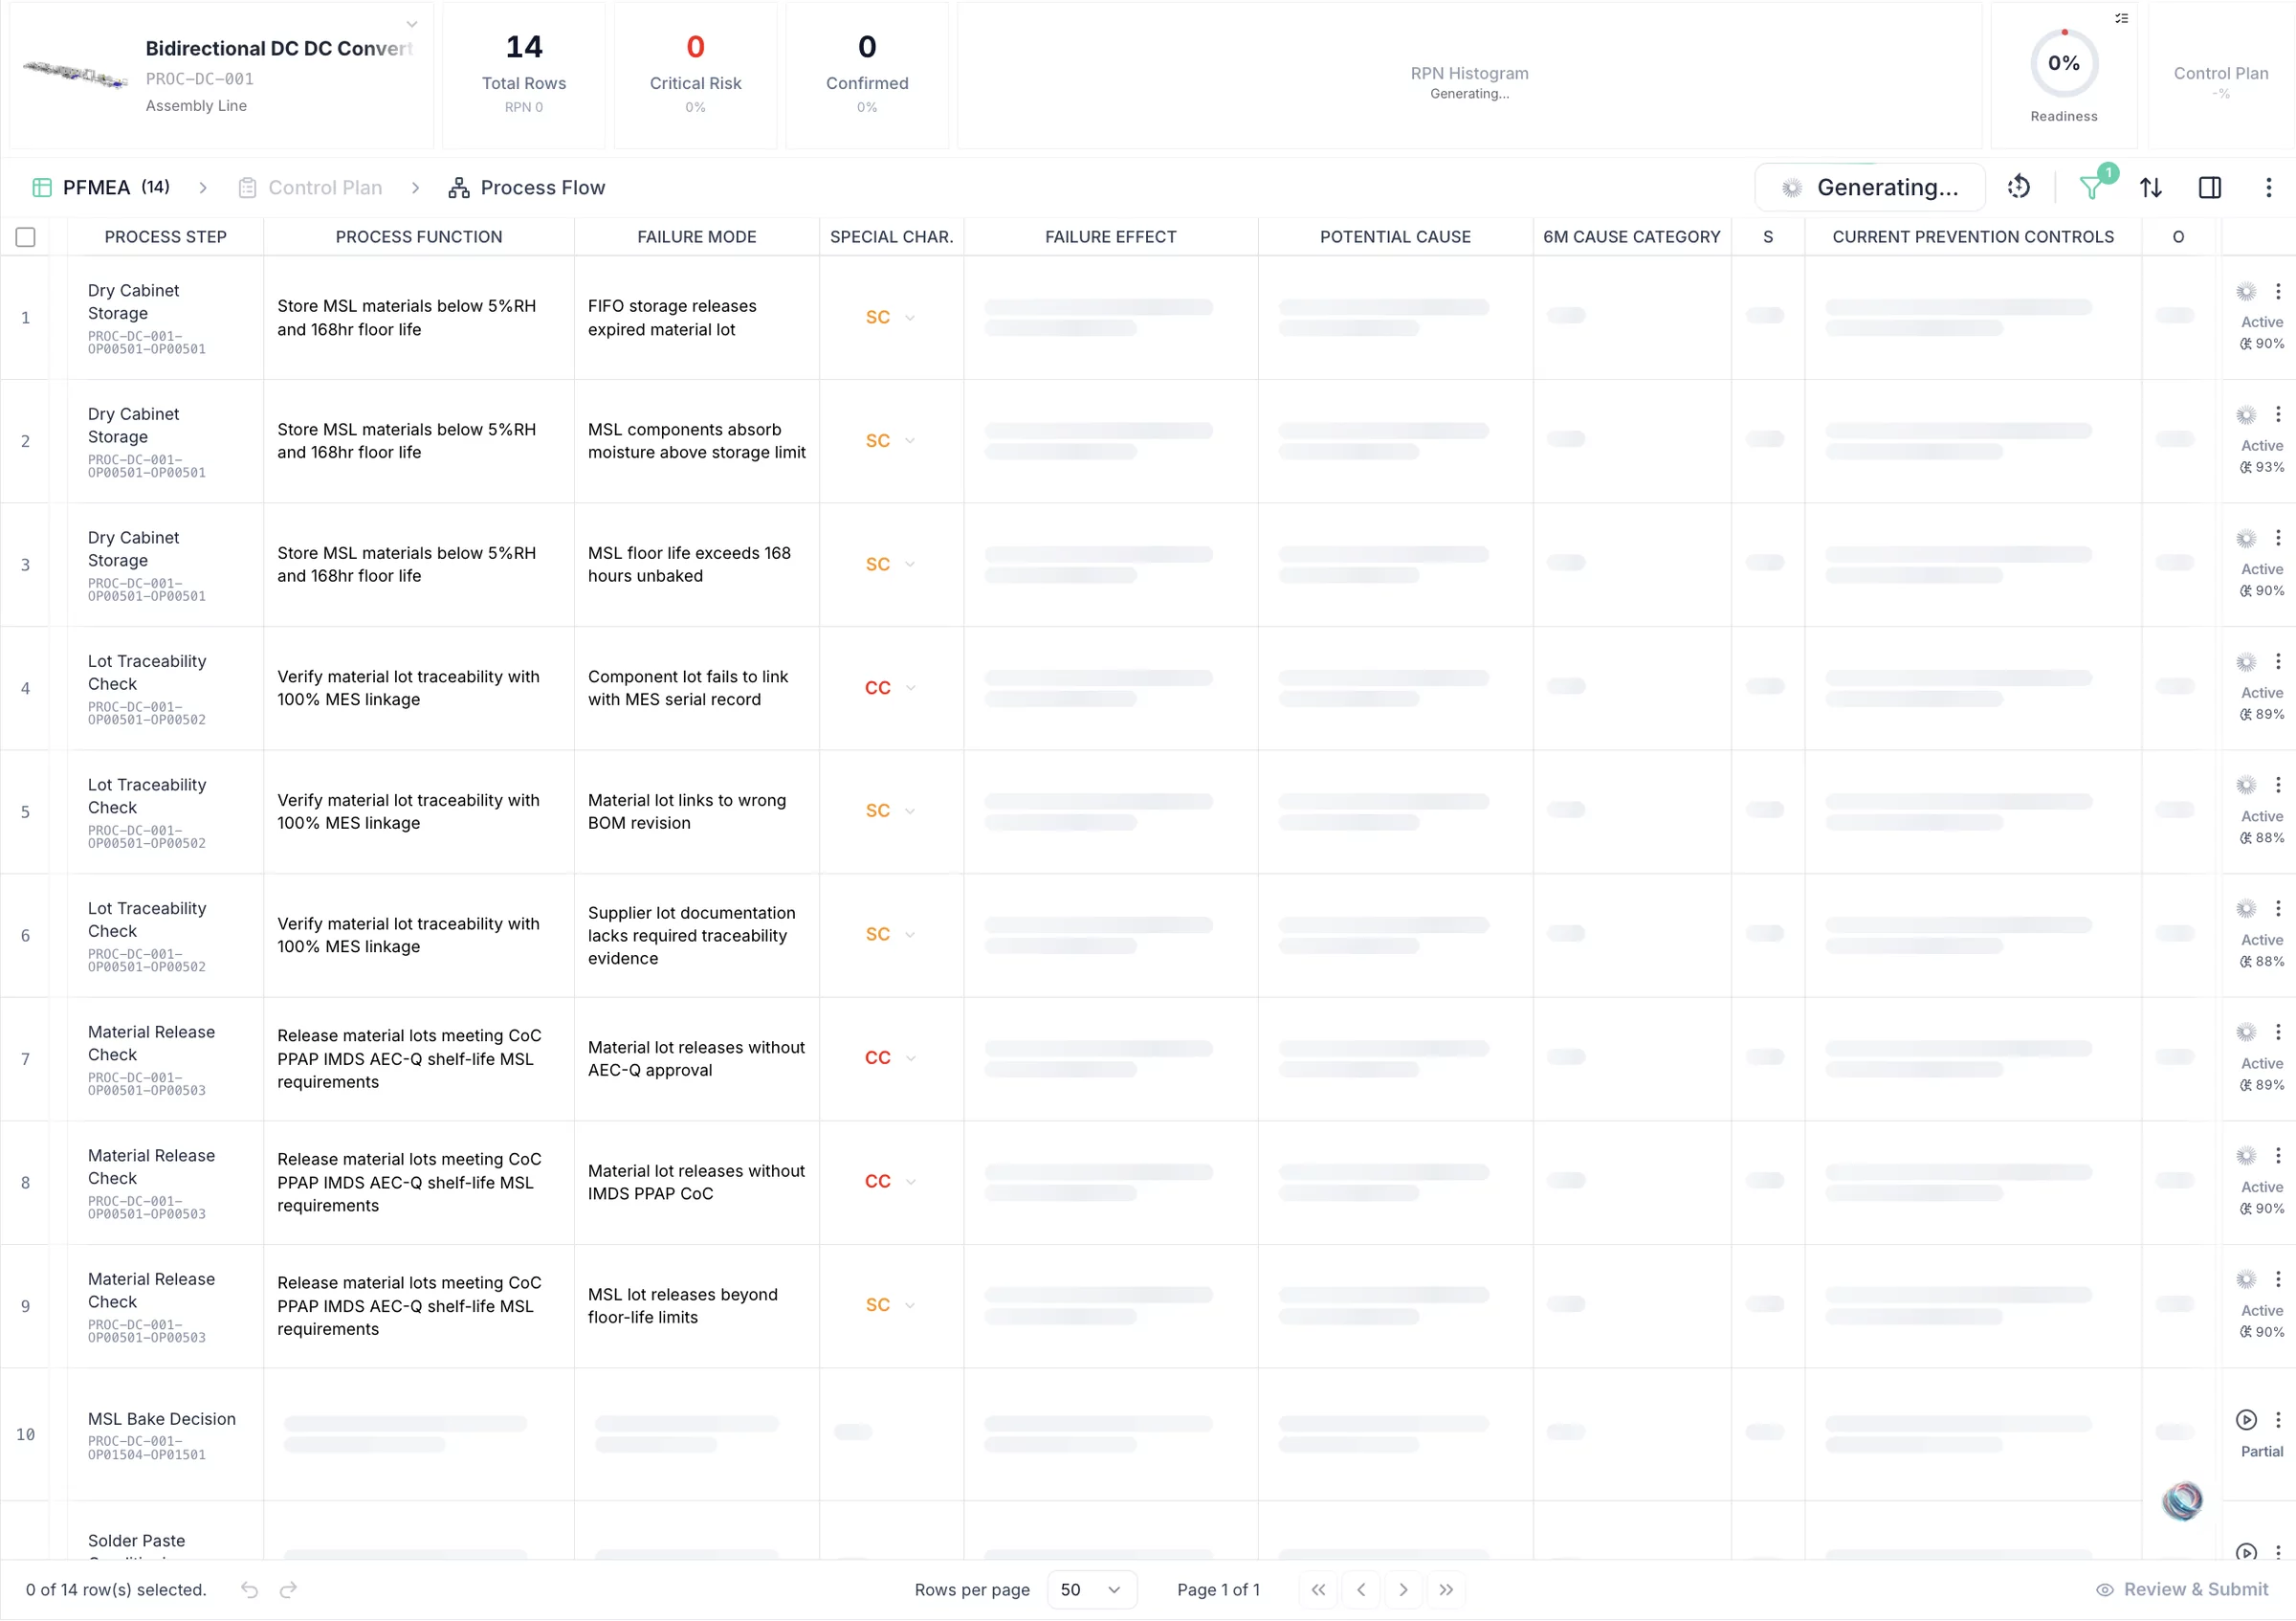
PFMEA generation. 6M cause analysis on every row.

Process functions mapped to each station. Failure modes derived from function loss or degradation. AIAG-VDA native with AP scoring and RPN. 6M cause categories on each row: Man, Machine, Material, Method, Measurement, Environment. SC/CC/HIC classifications inherited from DFMEA carry into PFMEA rows. Each row links to the source document it came from. Evidence panel with confidence score and page reference.

AIAG-VDA Native
6M Cause Analysis
AP & RPN Scoring
SC/CC/HIC Flow
Source Evidence

PFMEA generation with process steps, failure modes, 6M cause analysis, and confidence scores

03
"A pump failed last week. Is it in the PFMEA?"

Field failures feed back. Regressions flagged. Gaps surfaced.

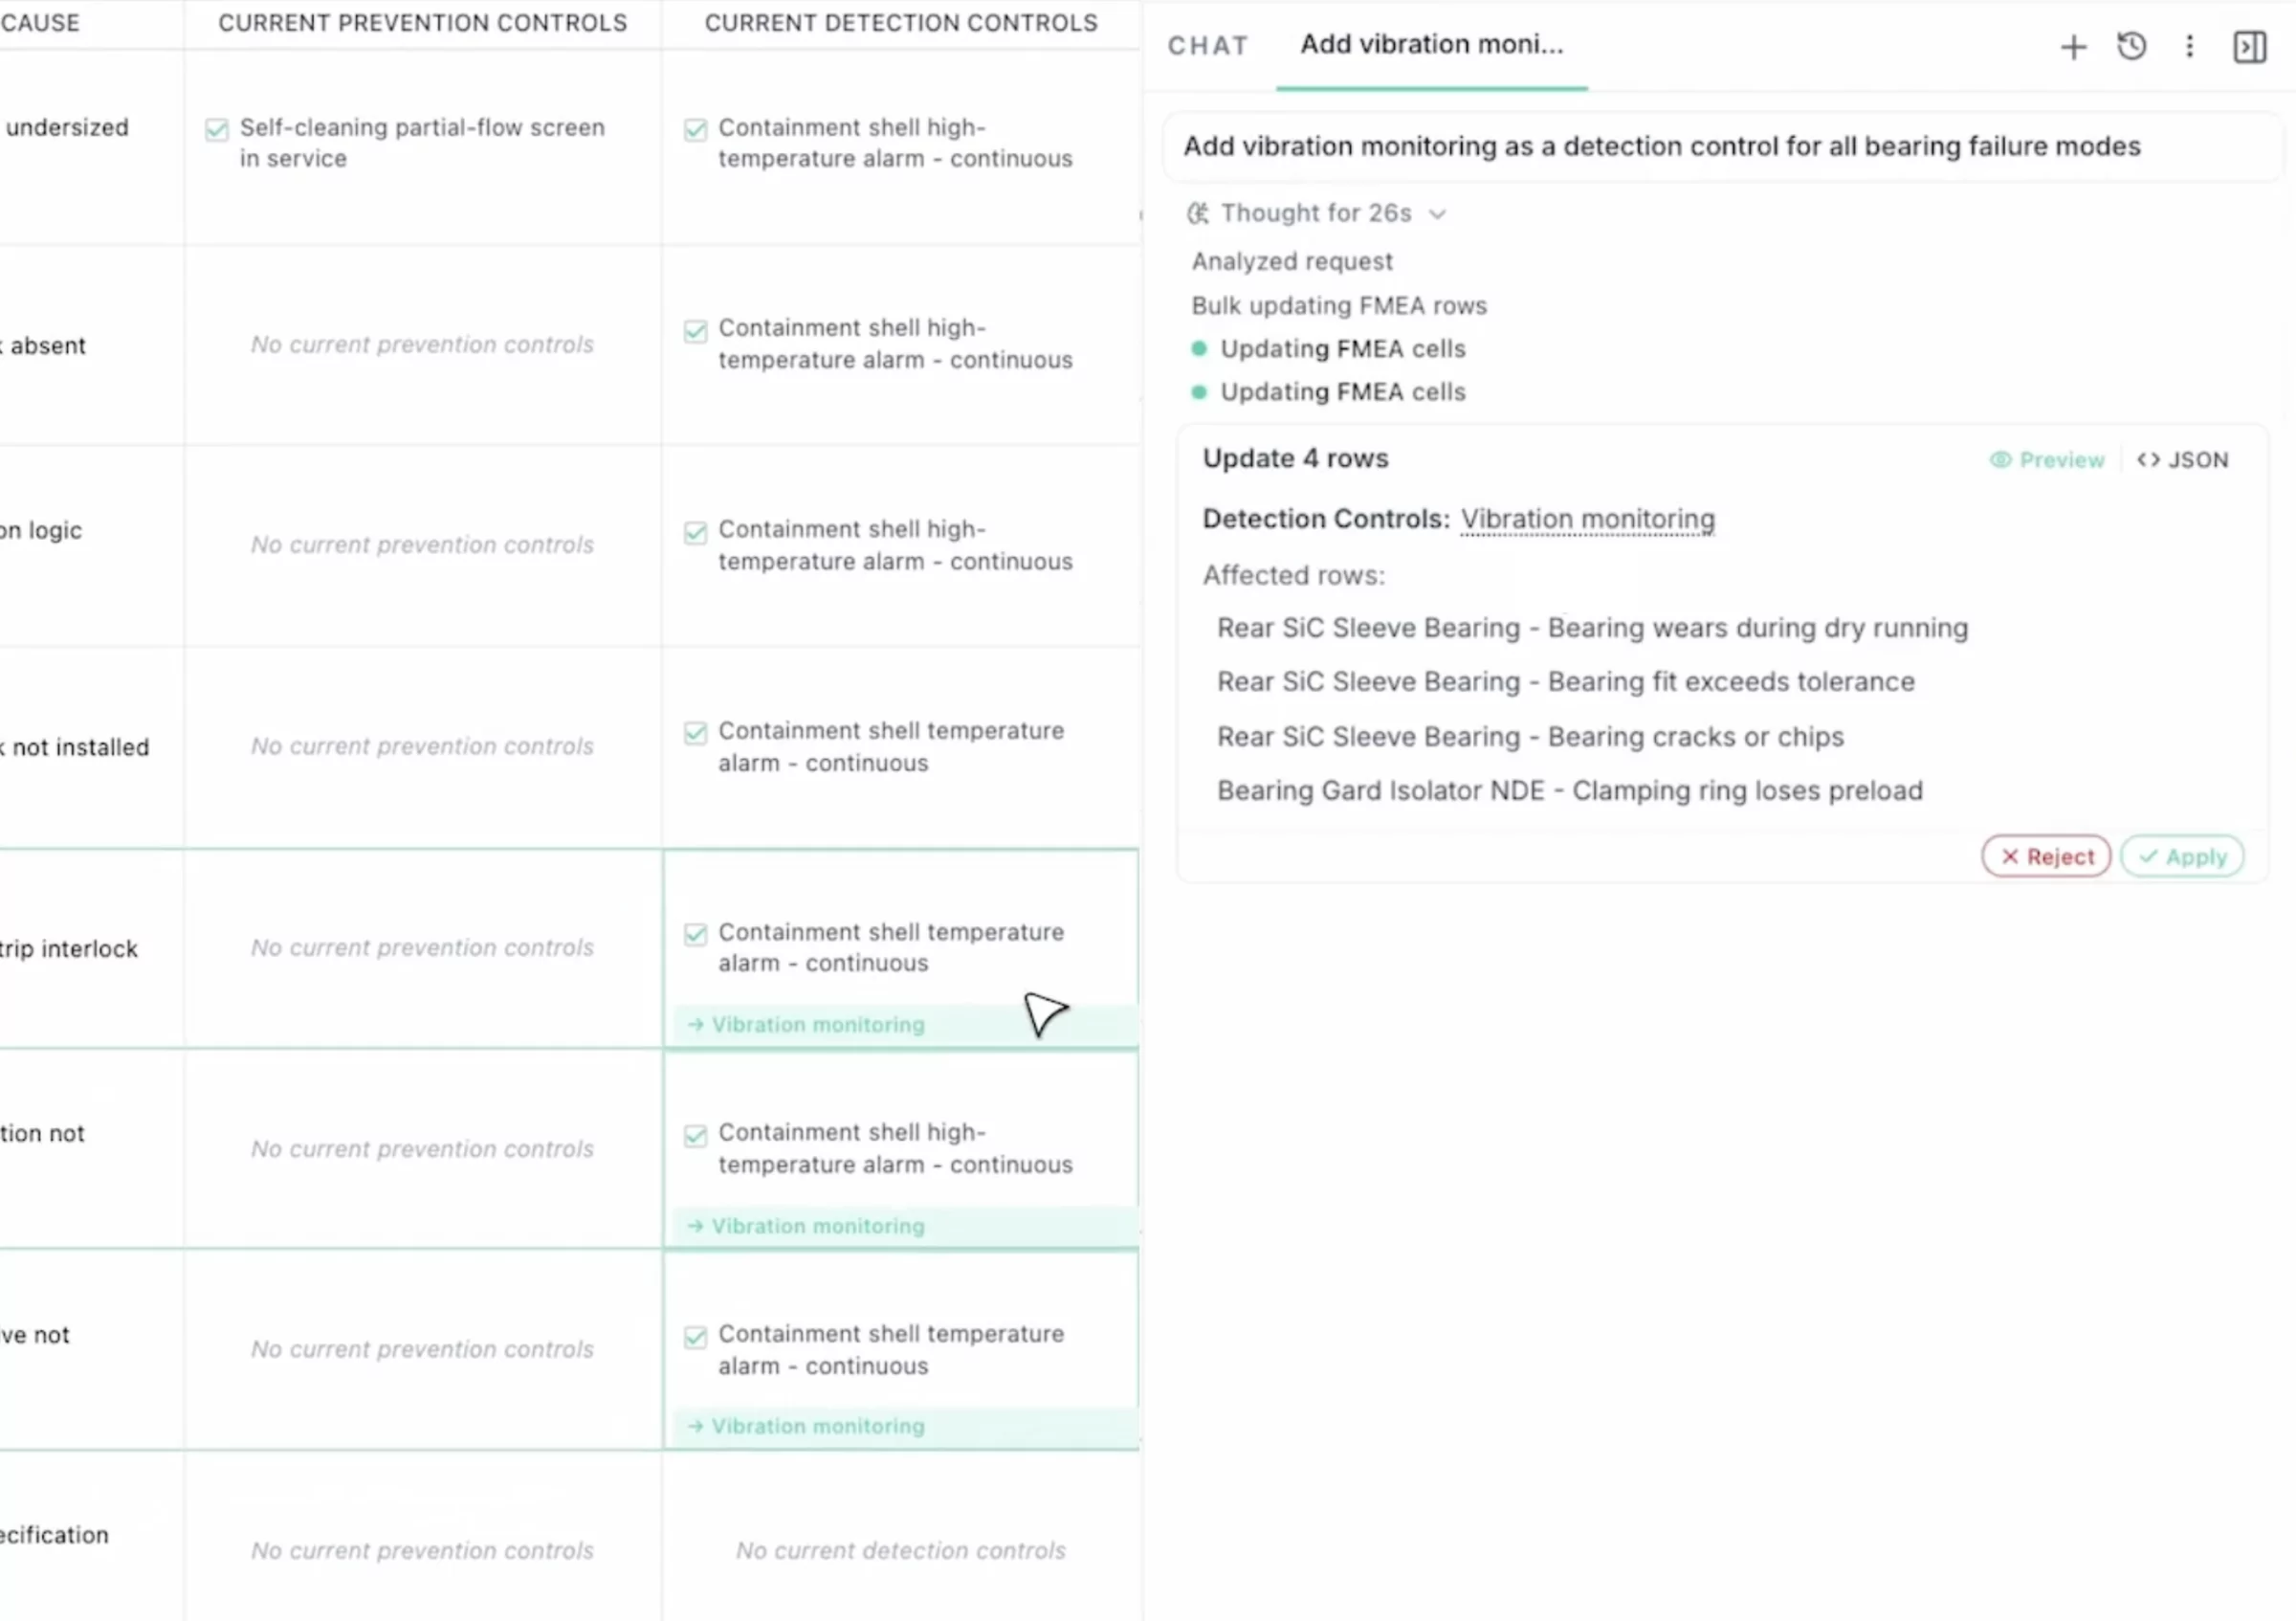
Defect records, scrap logs, 8D reports, and complaints matched to PFMEA rows automatically. Failure on a verified control step is flagged as a regression. New failure patterns that don't match existing rows are suggested as additions. The engineer decides. Nothing changes without confirmation.

Defect → PFMEA Matching
Regression Detection
Gap Surfacing
8D Integration
Human Confirmation

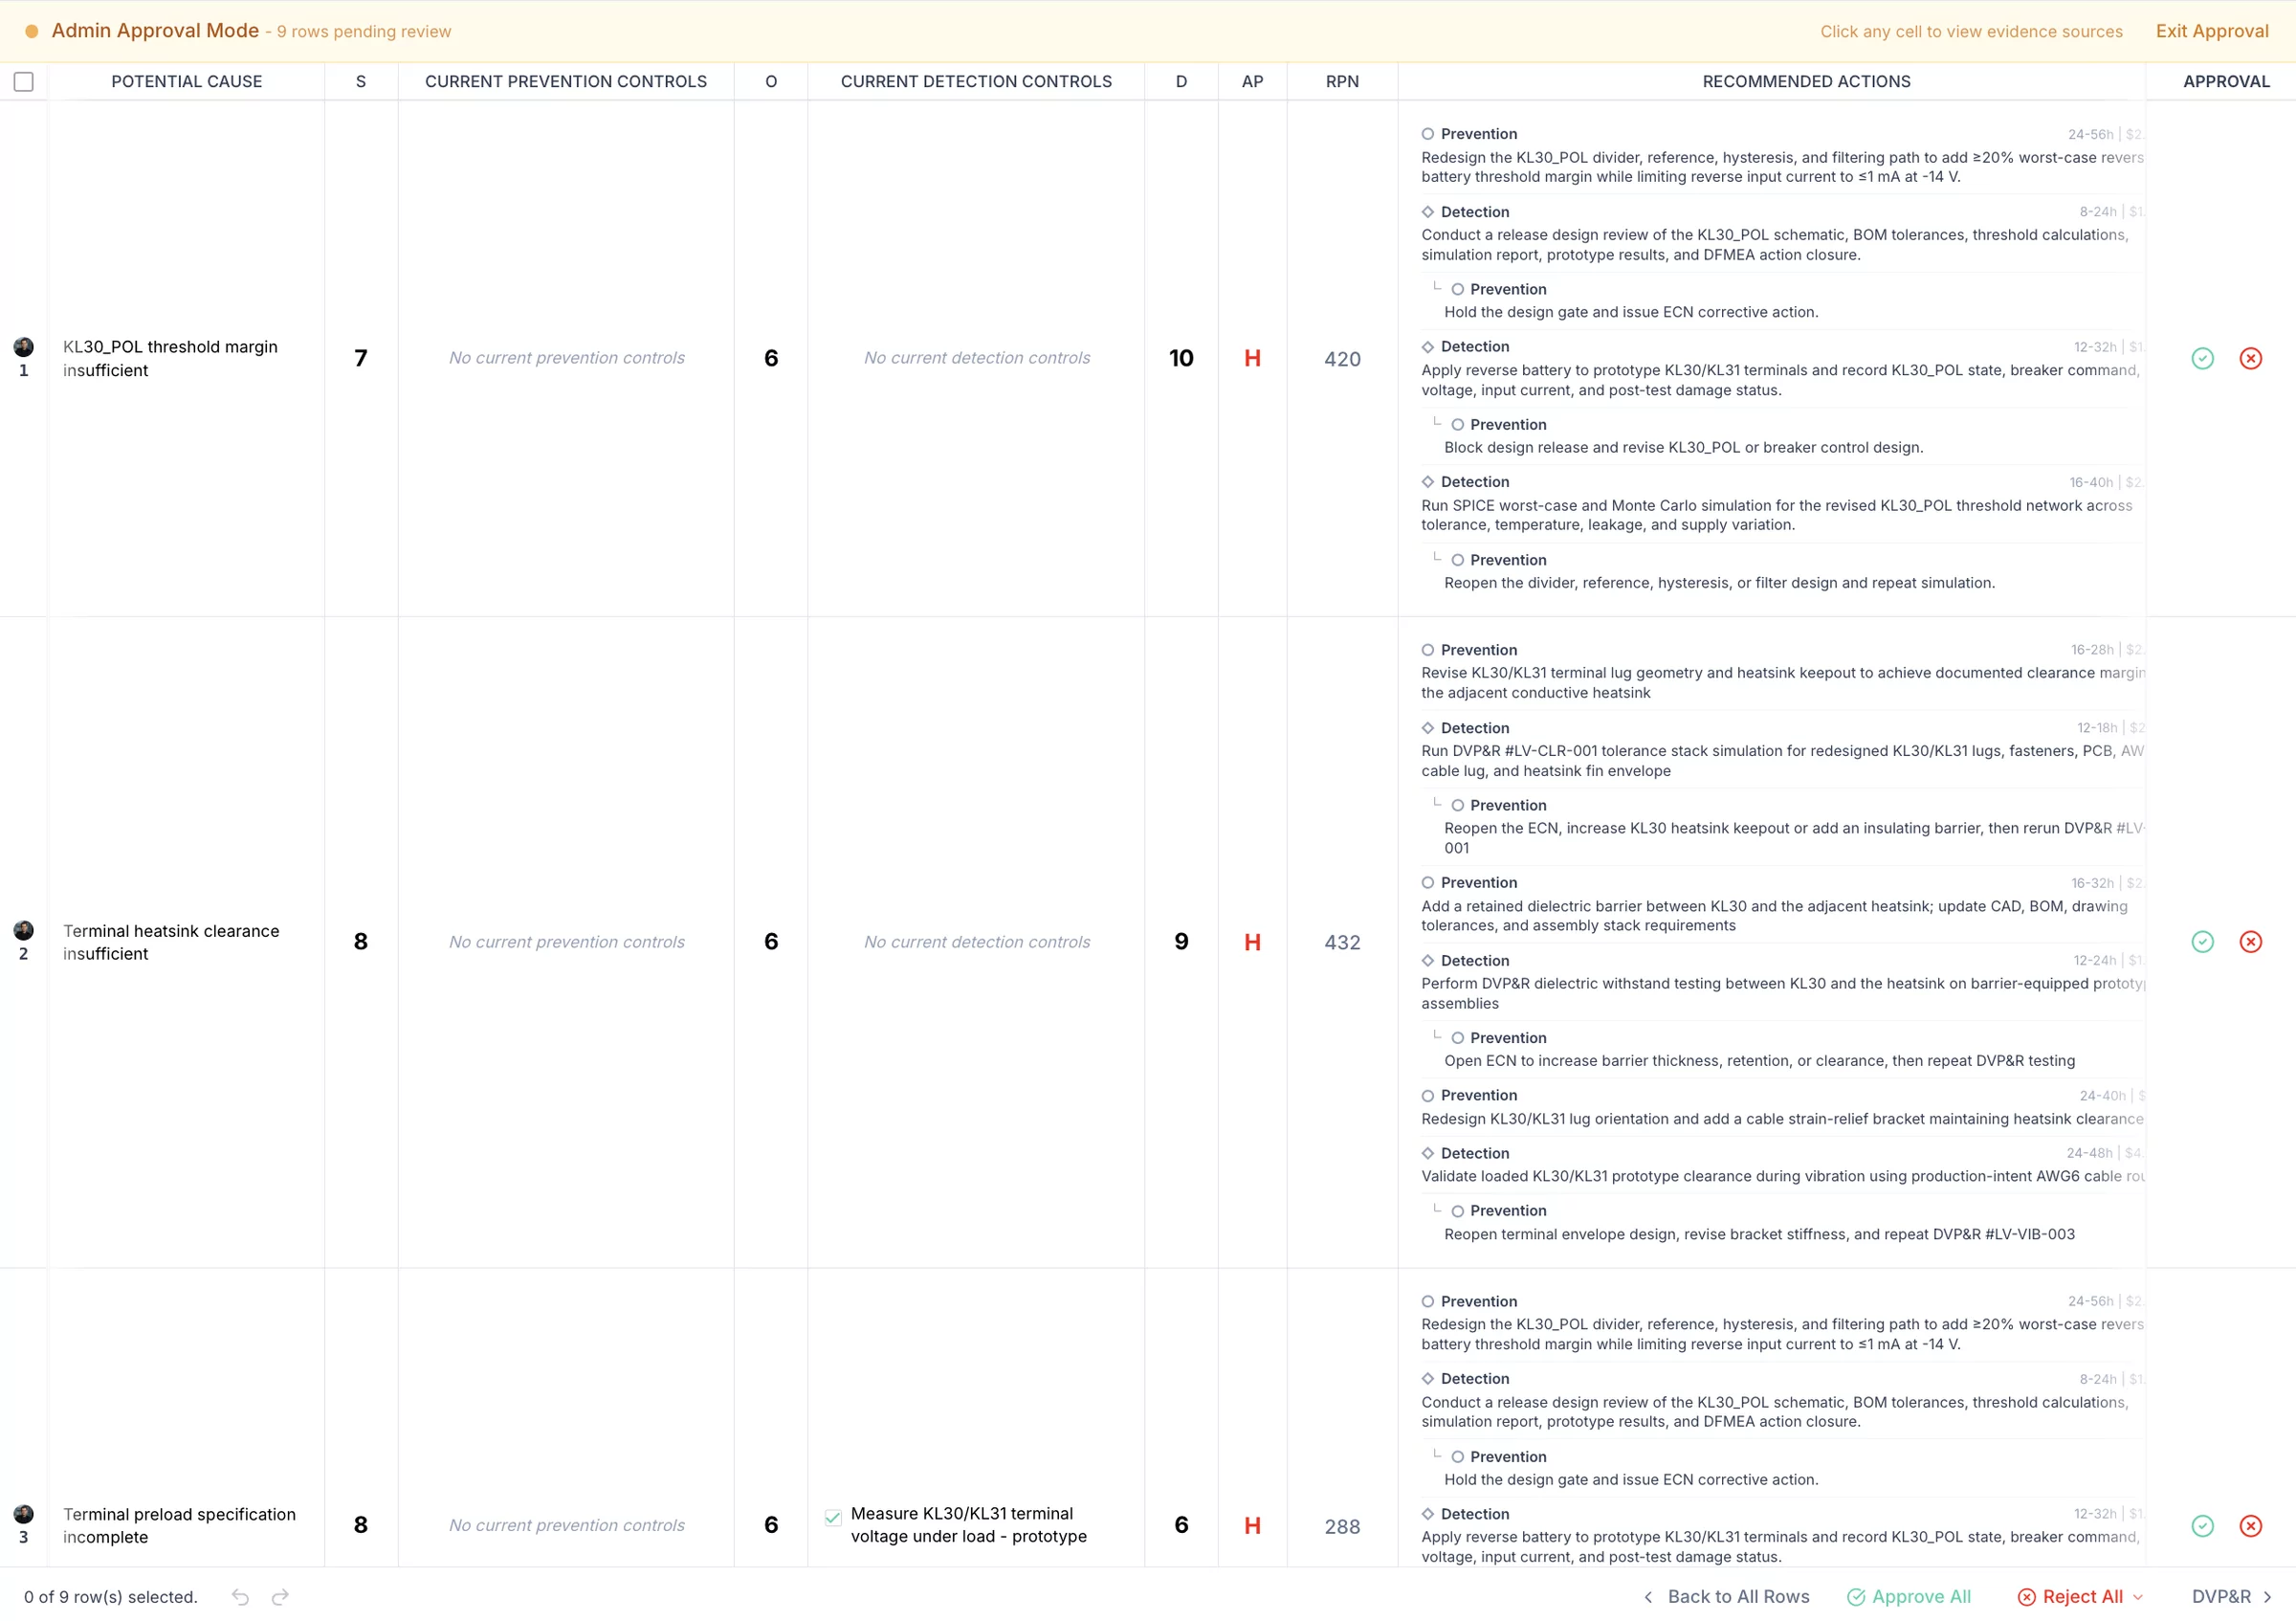
AI companion chat proposing detection control updates with approve and reject workflow

04
"Our control plan hasn't been updated since the last audit."

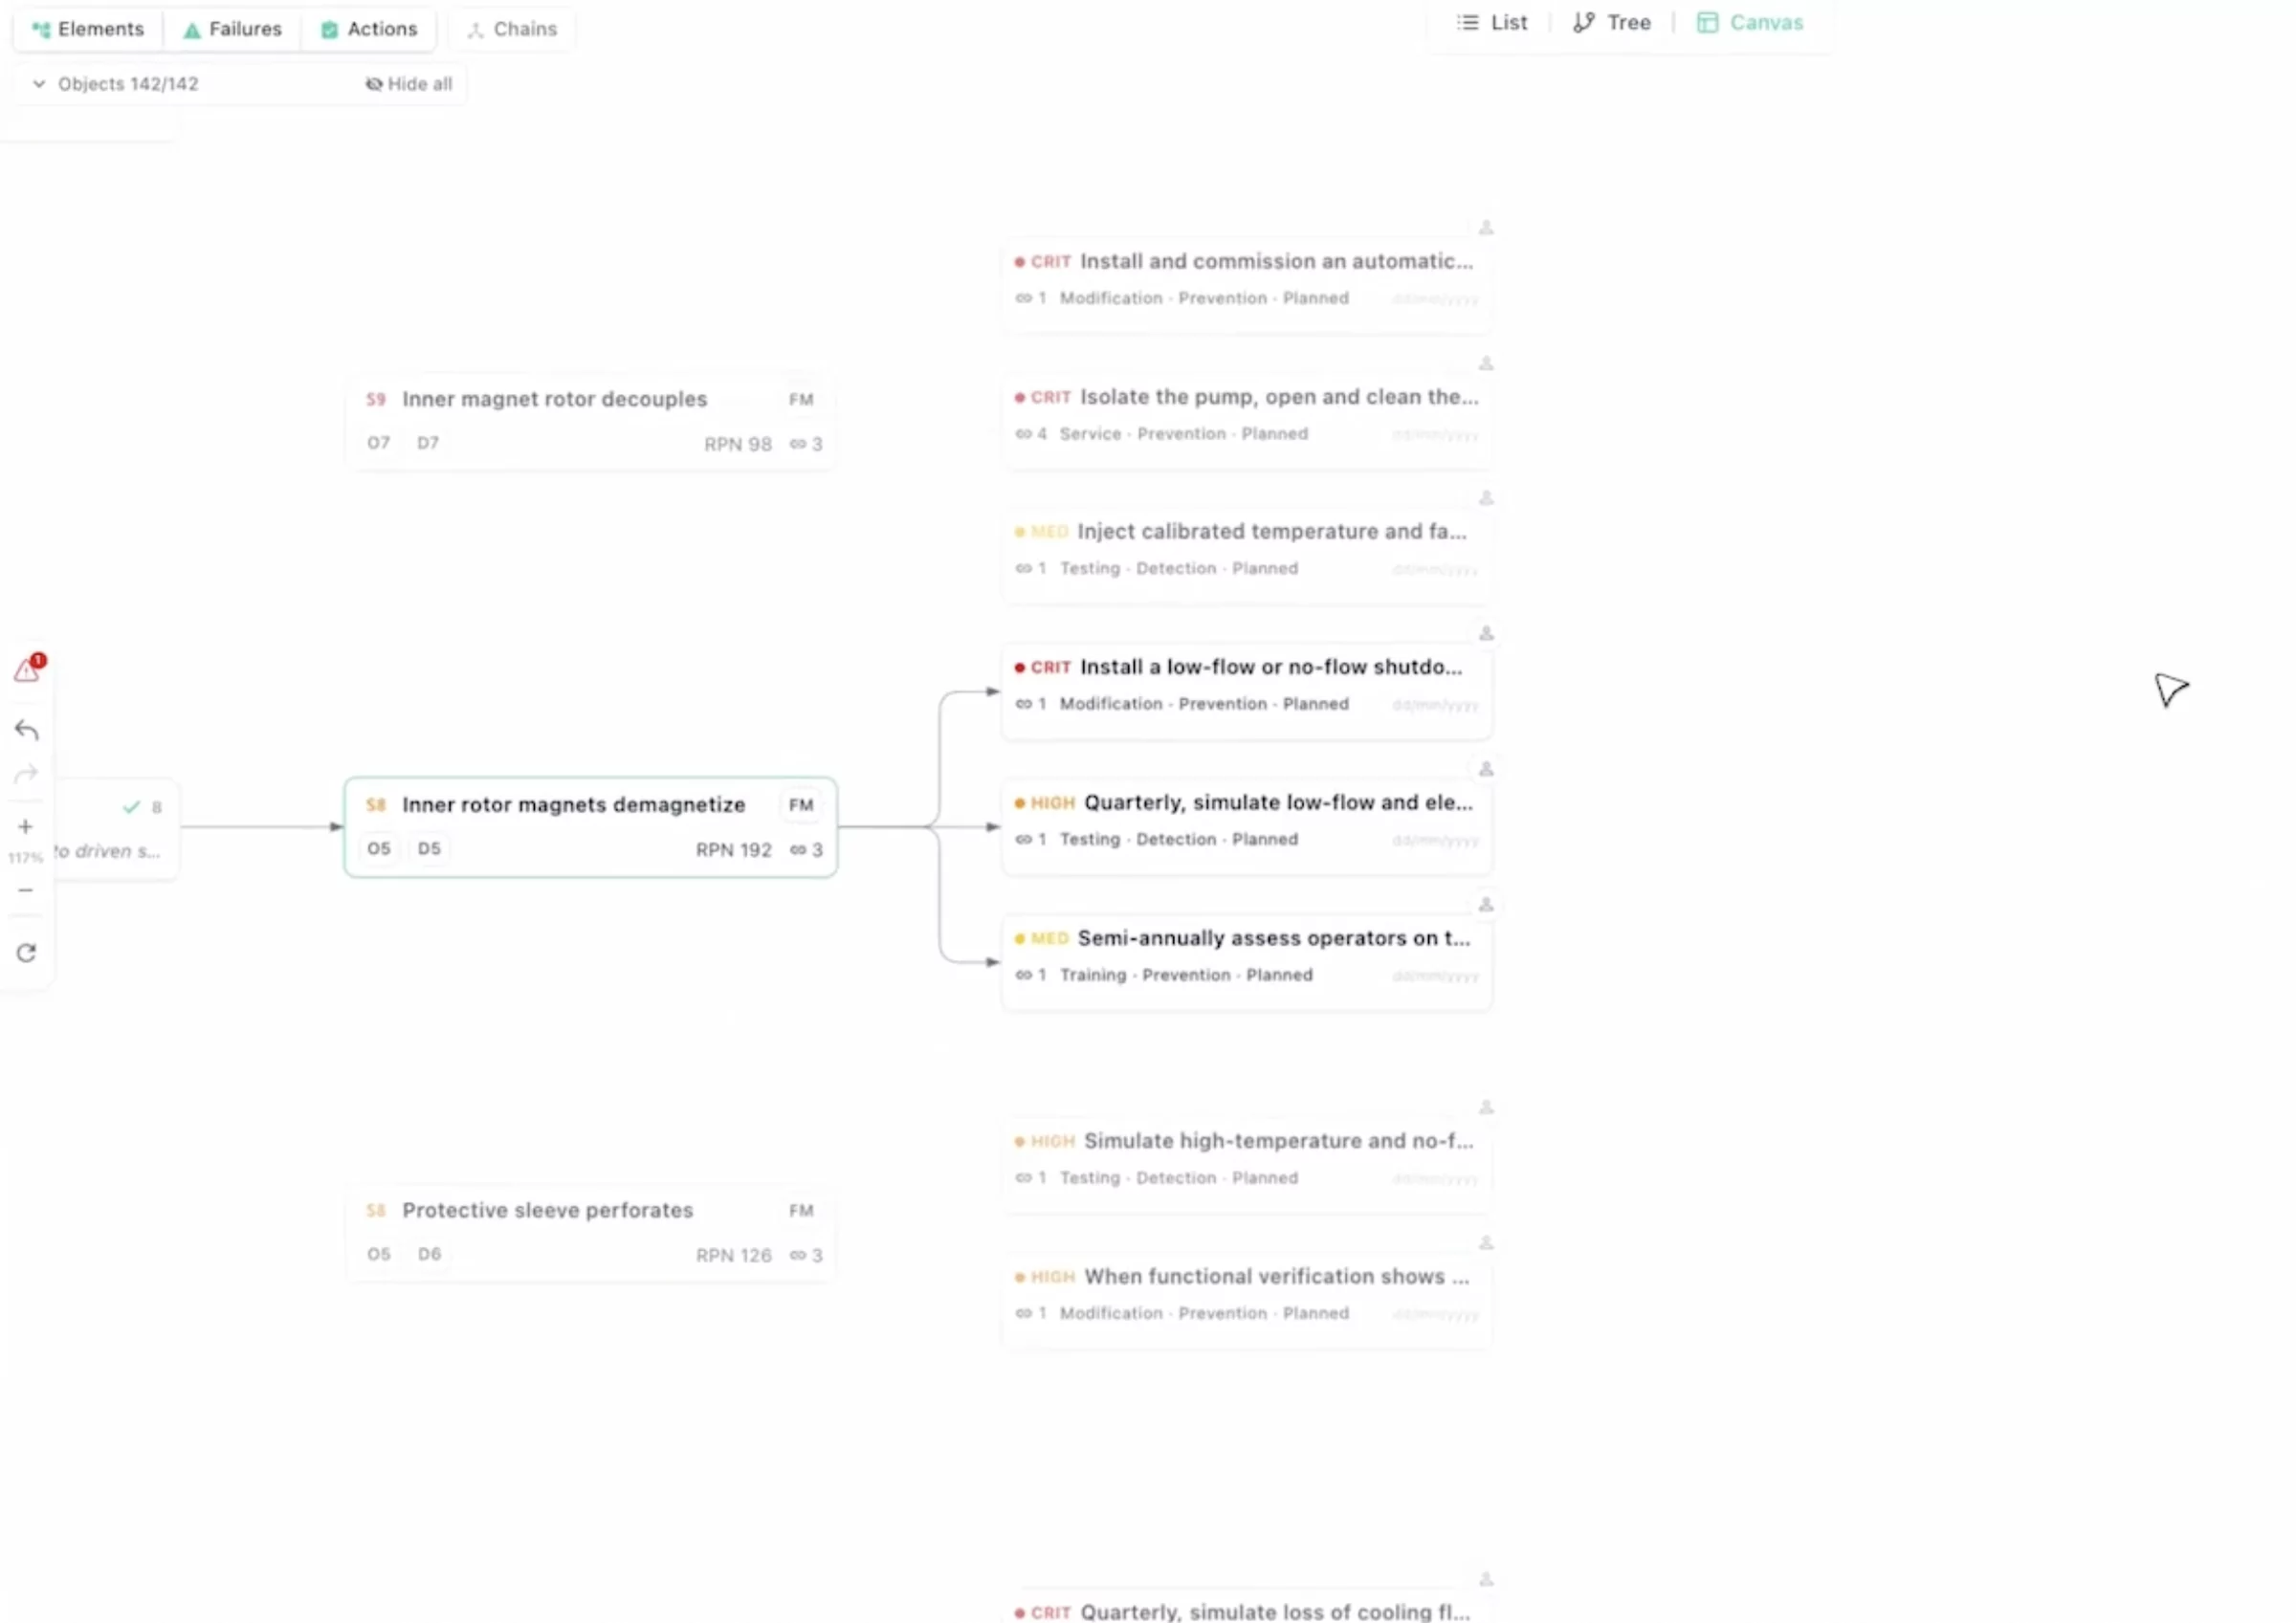
Control plans, SOPs, and PRTs. Linked to every PFMEA row.

AIAG-format control plans generated from confirmed PFMEA rows. Each entry has station, control method, sampling frequency, and reaction plan. Cpk/Ppk targets per characteristic. Gage R&R requirements per AIAG MSA 4th Edition. Detection ratings tied to actual measurement system capability. SOPs and work instructions generated per station with phase-grouped steps, tools, safety, and acceptance criteria. Process Reliability Templates (PRTs) for systematic capacity planning and process validation. PFMEA and control plan (PPAP elements 6 and 7) produced directly.

Control Plans
Cpk / Ppk Targets
Gage R&R / MSA
PRTs
SOPs & Work Instructions
Reaction Plans
PPAP Elements

Canvas view with failure modes, actions, and risk priority chains

05
"Add SPC as detection for all critical-to-quality modes."

Propose changes, review each one, approve or reject.

Ask a question, get cited answers from process specs and defect records. Ask for a change, the AI proposes cell updates with reasoning. Each change has its own approve/reject button. Nothing writes without sign-off. 34 languages.

Command Blocks
Per-Row Approve/Reject
Cited Answers
34 Languages

AI companion with per-row approve and reject workflow

06
"How does my PFMEA connect to DFMEA upstream?"

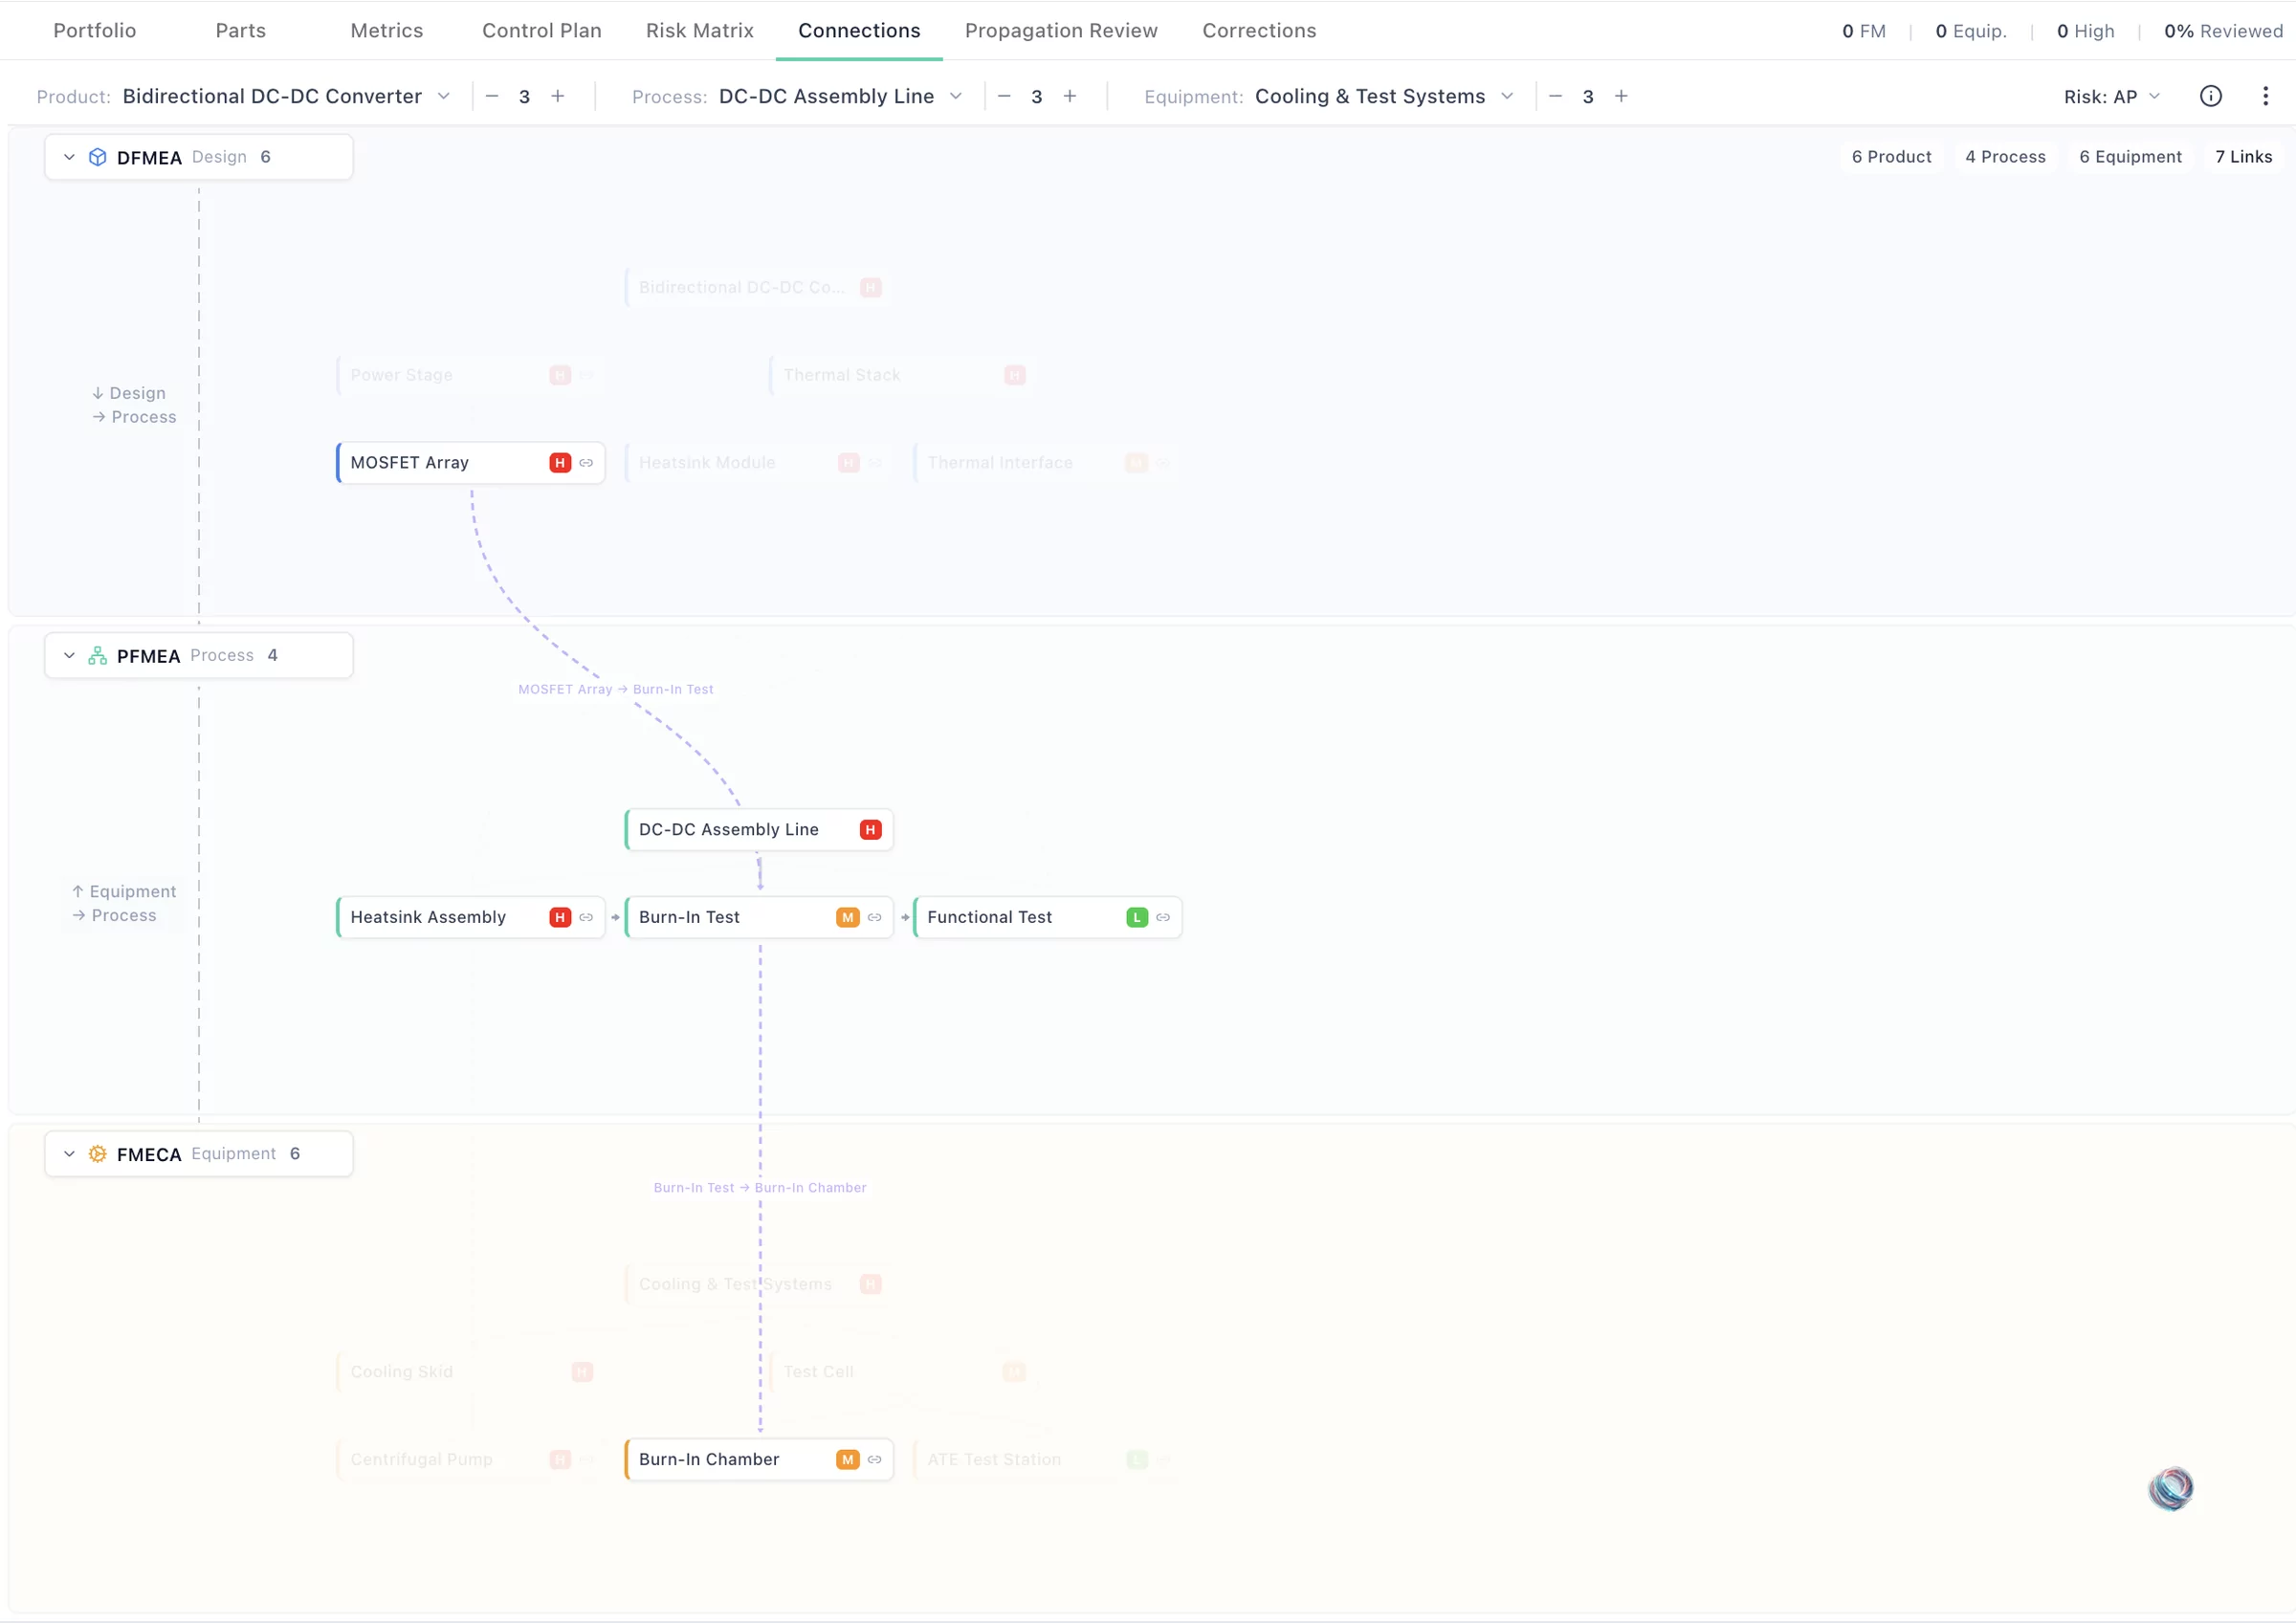
Three-lane canvas. DFMEA, PFMEA, control plan - all visible.

Three lanes showing how design severity flows into process controls. Click any connection to see what links them. DFMEA changes flag downstream PFMEAs and control plans. Template updates propagate to every linked PFMEA automatically.

DFMEA → PFMEA → CP
Visual Connections
Change Propagation

Connections canvas - DFMEA to PFMEA to FMECA three-lane view with linked failure modes

What You Get

See the process risks your current analysis doesn't cover.

PFMEA

Engineer-Ready PFMEA

70-90% complete. AIAG-VDA compliant with Action Priority (AP) and RPN. 6M cause analysis per row. Process steps, stations, and operation types mapped. All rows traceable to source.

Control

Control Plans with Cpk/MSA

AIAG-format control plans linked to PFMEA rows. Cpk/Ppk targets, Gage R&R requirements (AIAG MSA 4th Ed.), sampling frequency, and reaction plans per entry. Covers PPAP elements 6 and 7 (PFMEA and control plan).

Risk

Process Risk Report

Top process failure modes ranked by defect frequency, scrap cost, and detection difficulty. Your team knows where to focus.

SOP

SOPs & Work Instructions

Formal SOPs, procedure reference templates, and phase-grouped work instructions generated from confirmed PFMEA rows. Tools, safety, acceptance criteria on every step. Download from the sidebar.

Programs

Process Programs

Tasks grouped into costed programs automatically. Frequencies, pass-fail criteria, and cost estimates - all derived from the PFMEA.

Diagrams

Process Flow Diagrams & P&IDs

Process flow diagrams and P&IDs generated from your process data. Station sequences, instrumentation, and control devices mapped. Linked to PFMEA rows and control plan entries.

Supplier

Supplier PFMEA Validation

Sub-tier supplier PFMEAs validated against your process. Missing coverage, inconsistent AP ratings, and unlinked controls flagged before PPAP sign-off.

Loop

Closed-Loop Field Feedback

Production quality data matched to PFMEA rows. Regressions flagged. Gaps surfaced as new row suggestions. Controls marked ineffective when failures recur.

Audit

Audit-Readiness Report

Every PFMEA row scored against AIAG-VDA requirements. Generic failure modes, missing controls, and unsourced ratings flagged before your PPAP submission or IATF audit.

Pass your engineers' review → scale site-wide.

Maturity model

Meet your team where they are.

From no structured risk strategy to a fully auditable, cross-functional FMEA that feeds design changes, control plans, and process improvements.

L0
Reactive
No structured risk strategy. FMEAs don't exist or are checkbox exercises.

Data Quality
FMEA / FMECA
Dynamic Updates
Taxonomies
Optimization

L1
Basic
Static FMEAs in spreadsheets, rarely updated. Tribal knowledge, lost when people leave.

Data Quality
FMEA / FMECA
Dynamic Updates
Taxonomies
Optimization

L2
Connected
Data sources integrated. AI-assisted FMEA generation from process flows, quality data, and field evidence.

Data Quality
FMEA / FMECA
Dynamic Updates
Taxonomies
Optimization

L3
Dynamic
Closed-loop: design, process, and field FMEAs update automatically from operational events.

Data Quality
FMEA / FMECA
Dynamic Updates
Taxonomies
Optimization

L4
Closed-Loop
Fully auditable, cross-functional strategy feeding control plans, design changes, and process validation.

Data Quality
FMEA / FMECA
Dynamic Updates
Taxonomies
Optimization

Questions

Process FMEA questions, answered.

Defect data, scrap reports, and customer returns are primary inputs. The system extracts process failure modes from your actual rejection patterns - not generic templates. The more production data you provide, the more specific the PFMEA.

Each PFMEA failure mode generates a corresponding control plan row - characteristic, control method, frequency, reaction plan. Change the PFMEA, the control plan updates. They stay linked, not manually cross-referenced.

SPC data (Cpk, Ppk) feeds into detection and occurrence scoring. If a process is in control at Cpk > 1.67, the detection score reflects that. If Cpk drifts, the FMEA flags it. Your statistical process data becomes part of the risk model, not a separate silo.

When you upload new process parameters, defect data, or control limit changes, affected PFMEA rows are flagged and risk scores recalculate. No manual cross-referencing. The PFMEA stays current with your process, not frozen from the last workshop.

PFMEA, control plan, and process flow diagram outputs align with PPAP requirements. Export in your customer's required format. The documents stay linked so a change in one propagates across the set.

All outputs include source citations and require engineer sign-off. We generate the draft PFMEA from your line data - your engineers review, refine, and approve. They spend time on process improvement instead of populating rows from memory in a workshop. Corrections feed back so the next draft is better.

Bring one process flow.
See the risks your current PFMEA doesn't cover.

Your engineers judge the output. 30 minutes.

Privacy Settings
We use cookies to enhance your experience while using our website. If you are using our Services via a browser you can restrict, block or remove cookies through your web browser settings. We also use content and scripts from third parties that may use tracking technologies. You can selectively provide your consent below to allow such third party embeds. For complete information about the cookies we use, data we collect and how we process them, please check our Privacy Policy
Youtube
Consent to display content from - Youtube
Vimeo
Consent to display content from - Vimeo
Google Maps
Consent to display content from - Google
Spotify
Consent to display content from - Spotify
Sound Cloud
Consent to display content from - Sound